| |
Product(s): |
WaterGEMS, WaterCAD |
|
| |
Version(s): |
10.XX.XX.XX |
|
Overview
The CONNECT Edition release of WaterGEMS and WaterCAD introduces numerous improvements and features to help you be more successful. Let's explore each of these in detail.
Note: this article only covers the enhancements new to version 10.00.00.50. For information on even more enhancements new to the CONNECT Edition of Bentley's water products, see the list of "What's new" articles at the bottom of these articles:
WaterGEMS and WaterCAD TechNotes and FAQs
HAMMER TechNotes and FAQs
Video Overview

List of Topics
Compatibility
Interface
Layout & Data Input
Calculations
Results
Usability Enhancements
Supported Operating Systems
- Windows 10 (32-bit or 64-bit)
- Windows 8 (32-bit or 64-bit)
- Windows 7 (32-bit or 64-bit)
Compatible Platforms
WaterGEMS and WaterCAD CONNECT Edition standalone version does not require any CAD or GIS software to work. However, it can be integrated with the following platforms:
- MicroStation V8i SELECTseries 4 (Note: MicroStation CONNECT Edition integration is not yet supported with this release)
- AutoCAD 2016, 2017, or 2018*
- ArcGIS 10.2, 10.2.2, 10.3.1, 10.4, or 10.5* (WaterGEMS only)
*The updated CONNECT Edition release (version 10.00.00.55) added support for AutoCAD 2018 and ArcMap 10.5.
See:
Wiki: Platform Compatibility
Compatibility of Different CONNECT Edition Releases
Models saved in the updated release of WaterGEMS and WaterCAD (version 10.00.00.55) can be opened in the initial CONNECT Edition release (version 10.00.00.50).
See:
Blog: New release: CONNECT Edition with AutoCAD 2018 and ArcGIS 10.5 support
Ribbon Interface
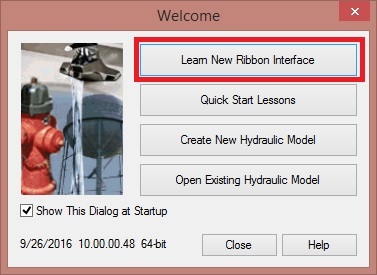
A new ribbon user interface has been added to the stand-alone products.

A button has been added to the welcome dialog to provide quick access to the ribbon interface Help documentation.
The application menus match the platform that the program is integrated with. Current versions of MicroStation V8i and ArcGIS do not use a ribbon user interface. Therefore this release of the Water products will not use the ribbon interface when integrated with MicroStation V8i or ArcGIS.
The following article provides an in-depth look at the new ribbon menu: Ribbon Interface for CONNECT Edition products
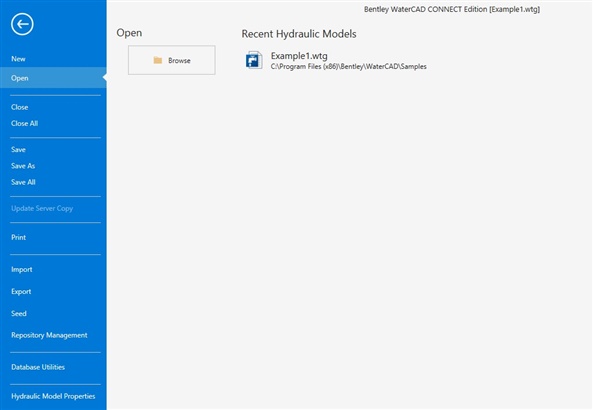
File and Help Menus
When the File tab is selected, the entire program dialog switches to display the File menu (ie. "backstage").
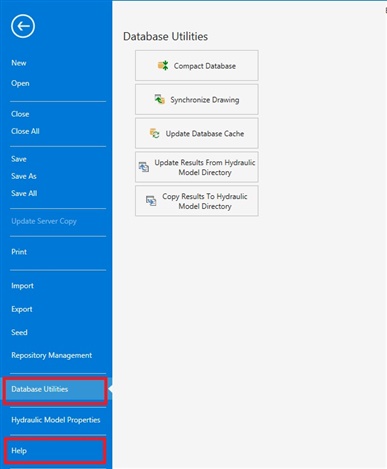
The Help menu and Database Utilities have been moved to the File menu.
Background Images
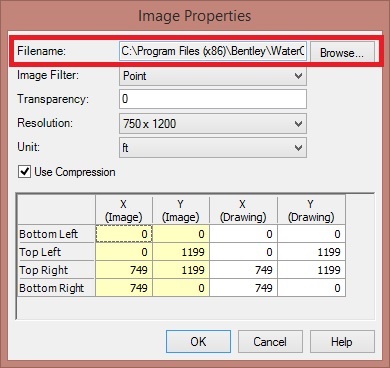
View and edit the path for background images
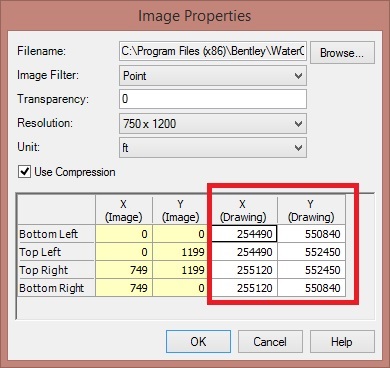
The Image Properties dialog now displays the image's filename and includes a Browse button to edit the field.
Improved background layer performance
Background layers are now loaded more efficiently so that less memory is consumed. This improvement is especially helpful when using multiple large files for background images.
World file support for background images
Some image formats support associated world files. When attaching a background image file that has an associated world file present, the image will now be spatially located automatically (i.e., georeferenced).
The following file formats support an associated world file.
- BMP
- JPG
- JPEG
- JPE
- JFIF
- TIF
- TIFF
- PNG
- GIF
The World file extension is based on the image's extension. One convention is to use the first and last letter of the image's extension and add a "w" (e.g., ".JPG" becomes ".JGW"). Another convention is to append the image's extension with a "w" (e.g., ".JPG" becomes ".JPGW").
When opening the file, the Image Properties dialog will automatically enter the coordinates from the World file in the editable (Drawing) fields.
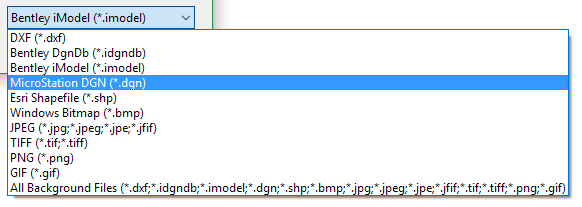
Bentley file format support for background layers
The following Bentley CAD file formats are now supported as background layers:
Taps and Laterals
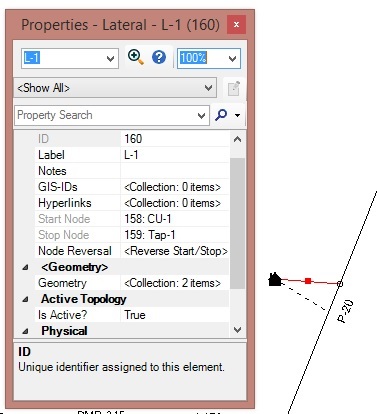
This release includes new tap and lateral elements. Lateral links are used to connect Customer Meter elements (e.g. houses and other demand locations) to elements in a model without the need to divide the downstream link elements into separate links in the model. This can significantly reduce computational effort since laterals are not included in hydraulic calculations. Laterals merely connect a customer meter to the hydraulic network for the purpose of assigning demand. If the Lateral is being used to connect directly to a link element, then a Tap node must be placed at the connection point. A Tap is a type of node that connects the Lateral to a pipe. It enables the user to add demands along a pipe without the need to break the pipe into multiple elements. There can be more than one lateral connection to a single trunk conduit.
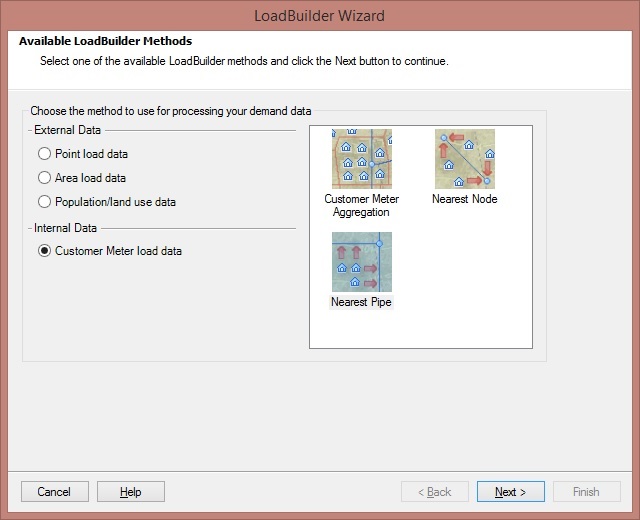
As mentioned above, taps and laterals are used in conjunction with the customer meter element. In previous versions, customer meter elements could only connect to junction nodes. Now a customer meter can also be attached by way of a lateral directly to the pipe, allowing for more accurate representation of demands along a pipe. Laterals can be automatically placed between Customer Meter elements and the hydraulic network using LoadBuilder and selecting Customer Meter Load Data as the available LoadBuilder method (see LoadBuilder section below). They can also be created manually or be imported using ModelBuilder if laterals are contained in the data source. While laterals have a Length property, they are not used in hydraulic calculations. If you want to perform hydraulic calculations for the lateral pipe, the lateral should be modeled as a pipe element. When you lay out a lateral the Associated Element attribute of the connected customer meter is updated. For a lateral connected to a node, the node becomes the customer meter's Associated Element. For a lateral connected to a tap, the element referenced by the tap becomes the customer meter element's Associated Element.
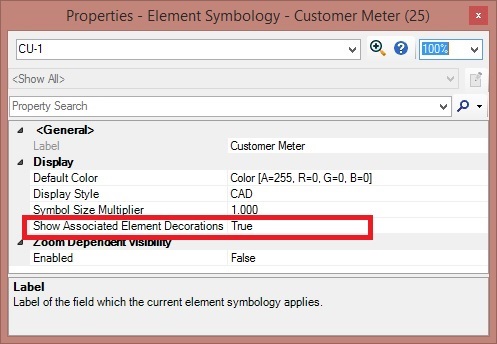
Even if you use taps and laterals to connect a customer meter to a pipe, you will still see the dashed line decoration connecting the customer meter to the pipe. If you want to turn this off, open Element Symbology and select the Customer Meter entry to view the properties. In the Element Symbology properties, you will see a property field called "Show Associated Element Decorations". Set this to False and the dashed line will not display.
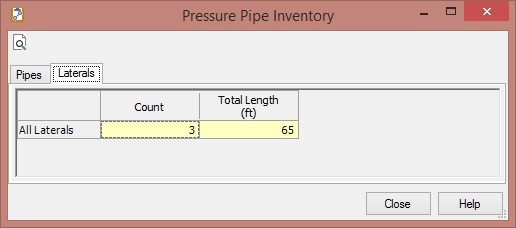
The laterals are included in the Pressure Pipe Inventory. To find this, go to the Reports and select Pressure Pipe Inventory. This will show the total length of pipes of different diameter and material type. There is now a Lateral tab which includes the number of laterals in the model and the total length they represent.
Queries
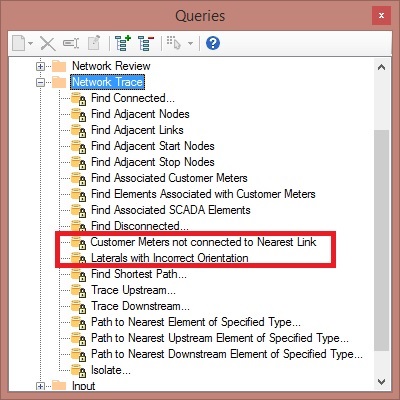
Two queries have been added to help with keeping track of customer meters and the laterals associated with them. These are "Customer Meters not connected to Nearest Link" and "Laterals with Incorrect Orientation." The query "Customer Meters not connected to the Nearest Link" will help identify customer meter elements that may be associated with the wrong element. The query "Laterals with Incorrect Orientation" will make sure the the customer meter element is correctly assigned as the start node of the lateral and the tap is correctly assigned as the stop node.
LoadBuilder
LoadBuilder can be used to assign isolated Customer Meter elements to the nearest pipe or node by creating a tap and lateral connection. If a customer meter is isolated (i.e., not associated with a node or pipe), LoadBuilder can be used to create laterals automatically between the customer meter and the hydraulic network. When this data source is used, it is assumed that that demand data is already available in the customer meter element.
See:
Turbine Energy Recovery Modeling
Turbines have been available in WaterGEMS and WaterCAD, though they are mainly used in HAMMER's transient analysis because of potential transient impact of startup and shutdown.
Starting with CONNECT Edition of WaterGEMS and WaterCAD, it is now possible to model turbines for energy and revenue generation using the Scenario Energy Cost module found under Analysis > Energy Cost > Scenario Energy Cost.
The general setup for turbines will be the same as for pumps. You can find information in the Help documentation under "Scenario Energy Cost Manager" or in the Energy Cost and Energy Management wiki.

In the Scenario Energy Cost manager, you will now see a Turbine tab. As with pumps and pump stations, you will select Energy Pricing and, if applicable, Unit Carbon Emissions. Energy pricing is set up in a separate manager.

The pricing data you use may be the same as the pump pricing data, depending on the setup of your system. One key takeaway is that turbines are typically used for energy generation. For this reason, the energy data in the turbine energy results is the energy generated, and the cost information is the revenue from the turbine.
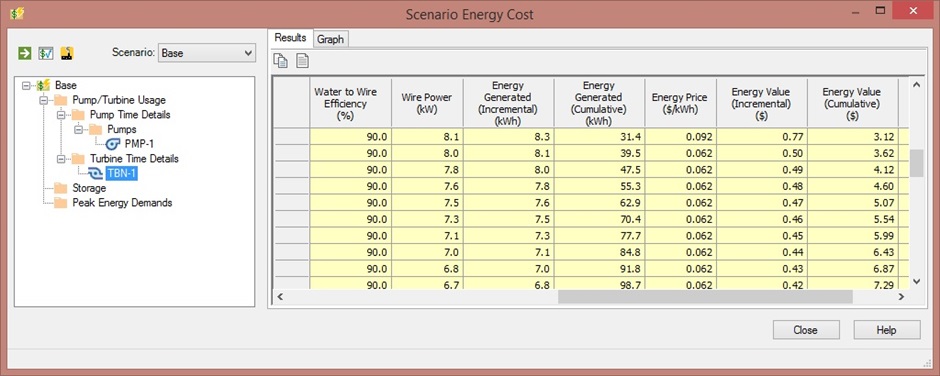
If you consider a case like the screenshot below, there is a pump and turbine in parallel. The setup of the model is such that the pump will be filling a downstream tank until the tank is full. The tank will then drain, passing through the turbine back to the reservoir upstream of the pump. In running the scenario energy cost analysis for this system, you can see that some of the cost for running the pump is recouped by having the turbine in place.
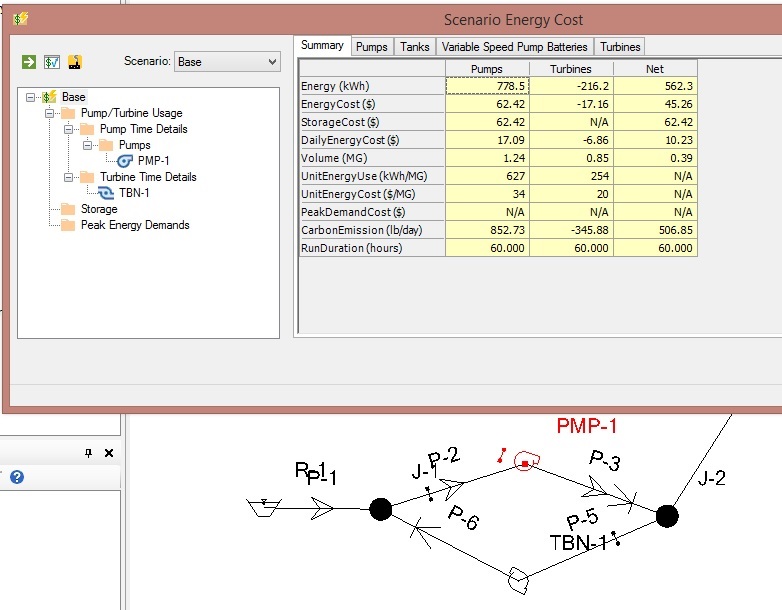
The energy cost data in the summary table above is a negative value because energy is being generated by the turbine. This allows you to see the net cost that includes the cost of running the pump and the revenue generated by the turbine.
See:
SCADAConnect Simulator Enhancements
Power Outage Event
Power outage events enable the user to mark pumps or variable speed pumps as being affected by a power outage. As part of the SCADAConnect simulator tool, this provides a simple interface for an operator to simulate the impact of such an event.
This tool is accessed from the Emergency Response Tab in SCADAConnect Simulator.
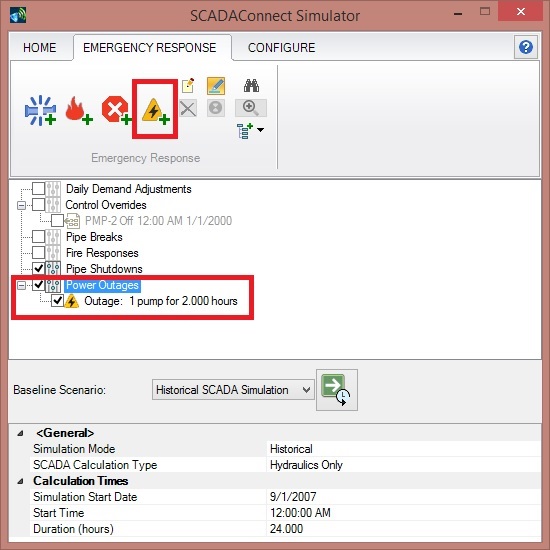
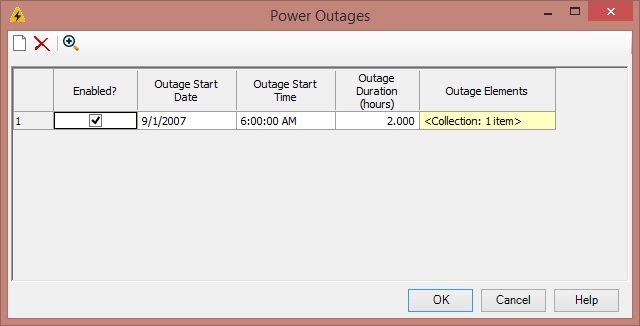
There are two ways to access this. You can either right-click on the Power Outage selection in the middle of the dialog or you can click the "Quick Add" button at the top of the SCADAConnect Simulator dialog. This opens a Select toolbar that allows you to select pumps that may see or have seen a power outage at some point. Once the pumps have been selected, you can enter the data in the Power Outage table, including the start of the outage and the length of time it runs.
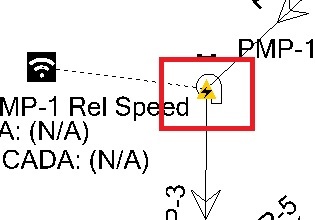
This will allow you to account for an outage during an historical simulation or to plan for an outage in real-time simulations. When the run is computed in SCADAConnect Simulator with a Power Outage applied, the solution will include the results when the pump is not available. You can include multiple power outage events in the simulation. If the event does not need to be included, you can uncheck the box in the Enabled column. When the pump is enabled for a power outage, the symbol below will appear over the pump in the drawing pane.
See:
Pipe Shutdown Event
Pipe shutdown events enable the user to shut down a portion of the distribution system and simulate the results of doing so. This allows an operator to simulate the impact of the closure of a pipe, in a simple interface.
This tool is accessed from the Emergency Response tab of the SCADAConnect Simulator.
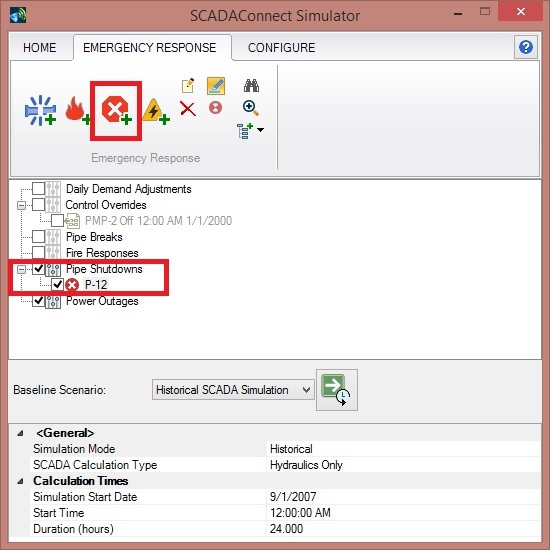
There are two ways to access this. You can either right-click on the Pipe Shutdown selection in the middle of the dialog or you can click the "Quick Add" button at the top of the SCADAConnect Simulator dialog. This opens a Select toolbar that allows you to select pipe or pipes that are part of the pipe shutdown.
Once the pipes have been selected, you can enter the data in the Active Pipe Shutdowns table, including the start time of the pipe shutdown and the length of time it lasts. Since the pipe shutdown involves closing valves or pipes, the next step is to isolate the pipe. The Auto-Isolate button at the top of the Active Pipe Shutdowns table allows for a simple way to do this.
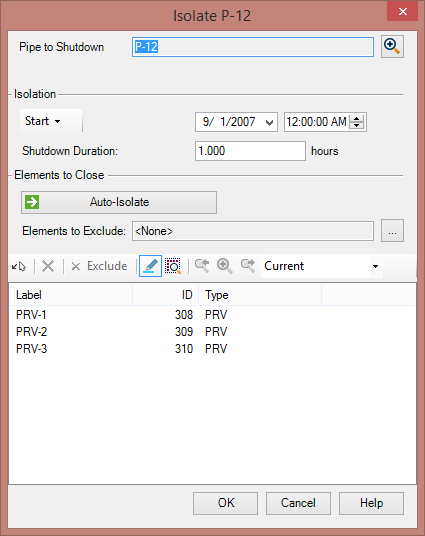
Click the Auto-Isolate button and the program will populate the valves needed to isolate the pipe. If there are no isolation valve or other valves in the model in that part of the system, the user can select pipe elements to close. It is up to the user to ensure that these pipes have sufficient valves to accomplish this isolation.
During the time that the shutdown is isolated, the flows in pipes in that area are zero and the demands are zero. The hydraulic grade and pressure in the isolated area will not have valid results.
See:
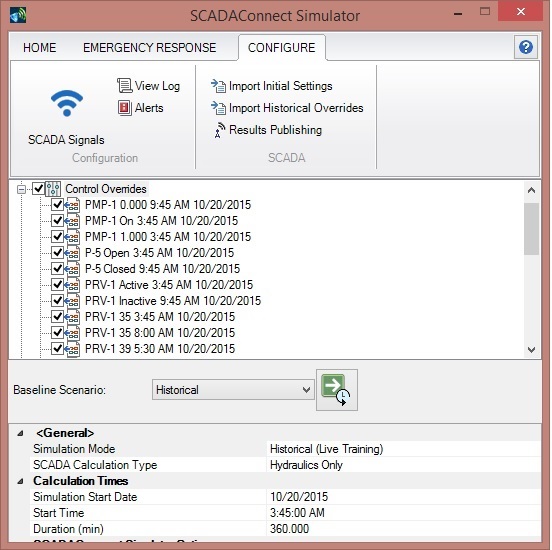
Import Control Overrides from SCADA source
In earlier versions of SCADAConnect Simulator, control overrides (cases where you may want to apply different controls than what is currently in the scenario) needed to be applied manually. With WaterGEMS CONNECT Edition, you can now import historical pump information to automatically create the controls in the model and apply the overrides. In SCADAConnect Simulator, select the Configure tab and choose Import Historical Overrides.
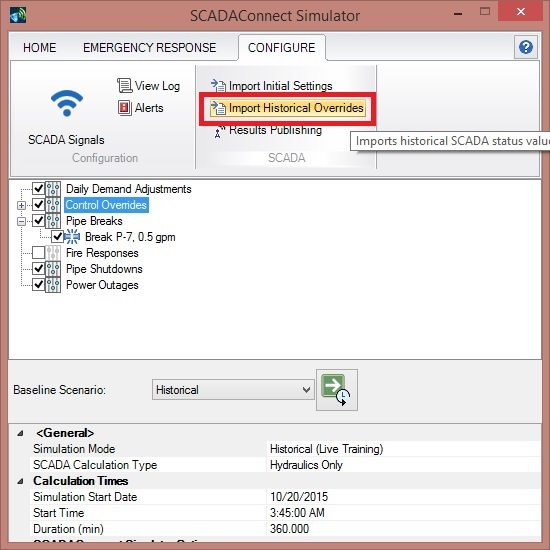
This will open a new dialog that will allow you to import the controls from an existing source file. The SCADA Signals will already need to be set up the correct source to do this. The SCADA Elements will appear in the box in the lower left. The control override can be filtered for a certain time span.
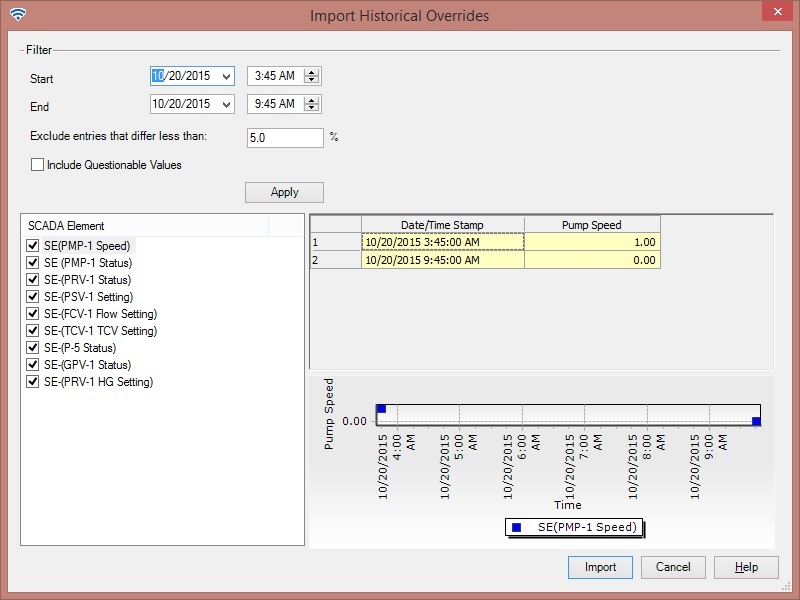
Once you have that selected, click the Import button to import the control overrides. They will then appear in the middle section of the SCADAConnect Simulator dialog.
Graphs
Quick Graph
The new Quick Graph feature provides a fast way to view a graph of a single element in the drawing. The Quick Graph automatically updates to display data for a selected element. They can be docked, allowing easy viewing of results along with the general model layout.
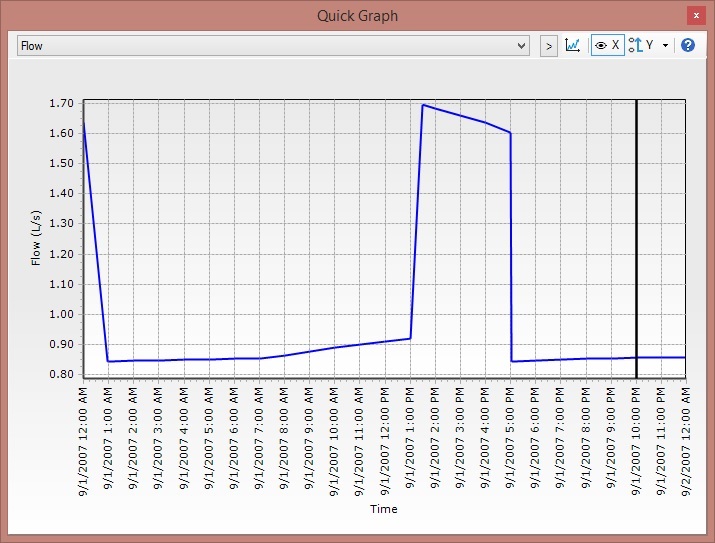
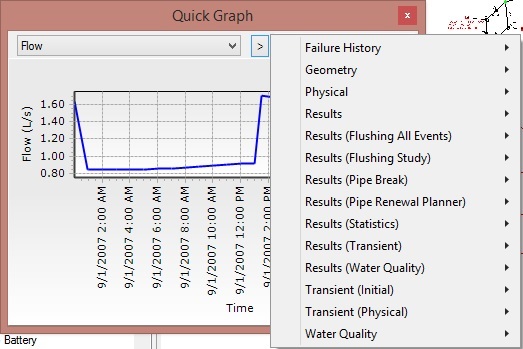
By clicking the pulldown menu, you can select from a few common results. Click the ">" button and you can choose from another number property fields.
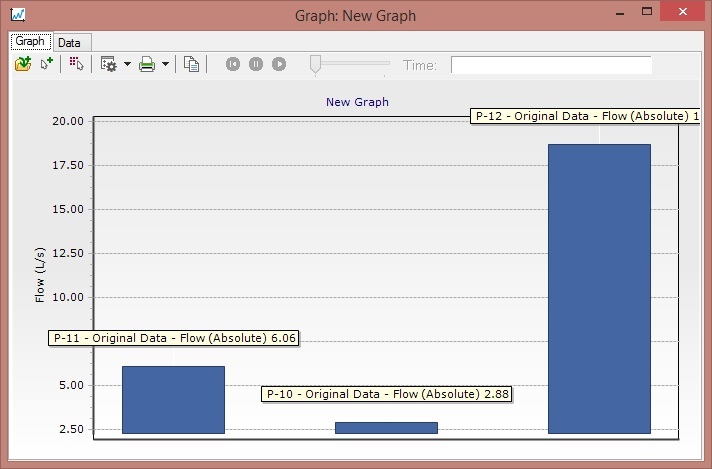
More meaningful steady state graphs
If the current scenario is steady-state, the default graph is a bar chart for the selected elements. Elements from different scenarios can also be added in the Series Options dialog. The Series Options dialog can be used to customize the information displayed in the graph (scenarios, elements, and fields).
"Select in drawing" in Graphs and Graph Manager
In the graphs manager you now have an additional option "Select in Drawing". When a saved graph is selected and you click this button it will select the elements that are part of the saved graph.
Profiles
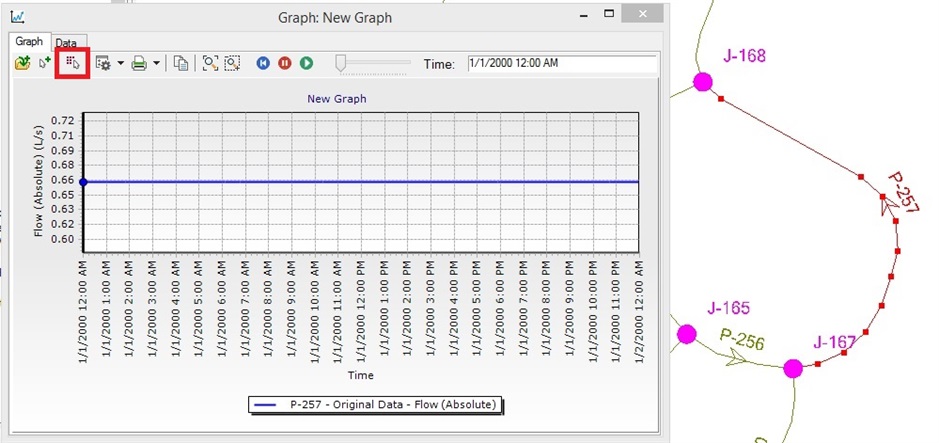
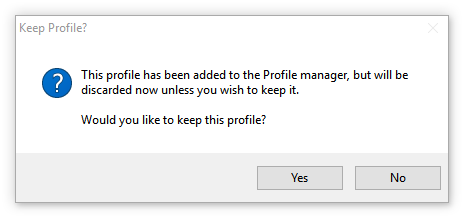
Create profiles without adding to Profile manager
In previous versions of WaterGEMS and WaterCAD, if you wanted to view a profile, it needed to be saved to the Profile manager first. With the CONNECT Edition release of the products, you can now view profiles without saving it first.
To view a profile of just a pipe and its two end nodes, right-click on the pipe and select Create Profile. This will allow you to view the profile directly without saving. To a longer profile between two nodes, right-click on a node element, then select the stop node of the profile. As with the single pipe, you can view the profile without saving to the Profile manager. When you close the profile viewer for a temporary profile, you are asked if you want to save it. When you select Yes to this prompt you will have the chance to enter a label for the profile.
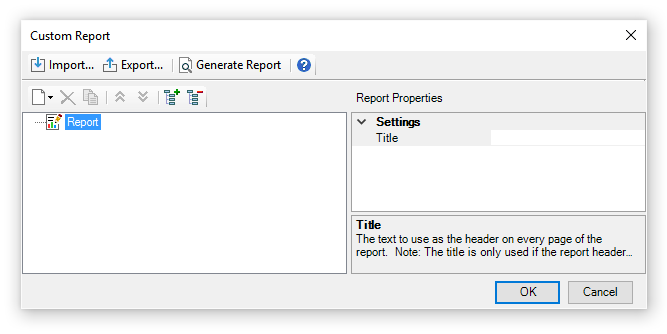
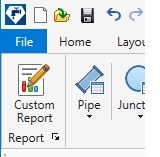
Customizable Reports
A new Custom Report tool has been added to the Report tab. This tool allows you to quickly assemble a customized report which can contain user input, results, graphs, etc. You can now define the template interactively instead of modifying an XML file manually.
The reports can be exported to the following formats
- PDF
- HTML
- MHT
- RTF
- Excel
- CSV
- Text
- Image
The Report Options dialog can be accessed by clicking the icon below the Custom Report icon. This dialog allows you to control how reports are displayed (eg. font, header, footer, margins).
See:
- Help "Custom Reports"
- Help "Report Options"
Record AVI video from time results
The AVI Screen capture enhancement allows you to record videos of scenario animations. You can select which portion of the screen will be recorded. The screen capture utility will capture and record all the frames of the animation within the bounds you specify and produce an AVI video file which is shareable outside of the water products.
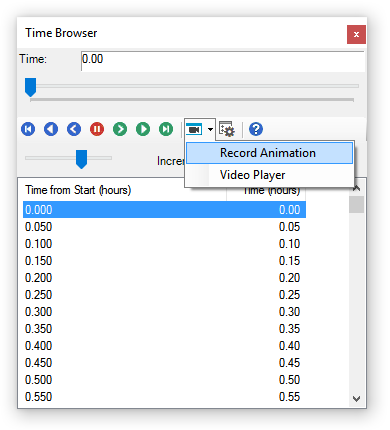
An internal video player allows you to watch the video after it is done recording.
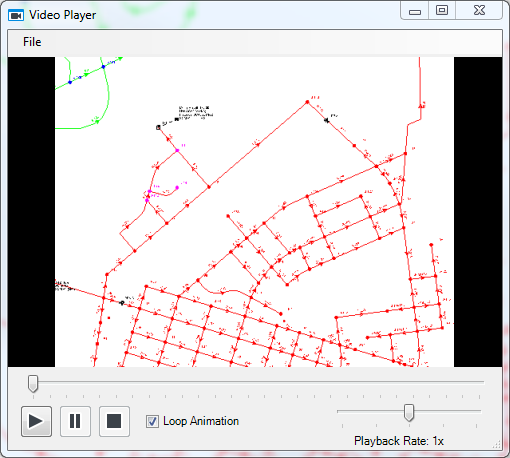
See: Help "Recording Scenario Animations"
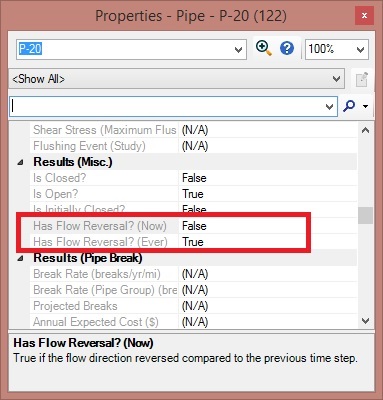
Flow reversal results for pipes
New results fields have been added to the pipe property grid and the pipe FlexTable that report when flow in the pipe is reversed, i.e. when the flow in the pipe goes from the stop node to the start node. These fields are "Has Flow Reversal? (Now)" and "Has Flow Reversal (Ever)". This will allow the user to see if flow reverses at the current time step or at any point in the model simulation.
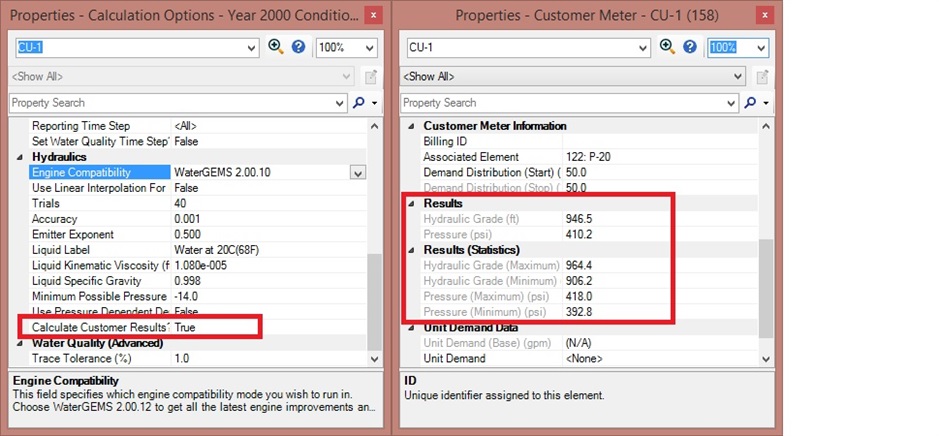
Hydraulic Grade and Pressure results at Customer Meter Element
New results fields for hydraulic grade and pressure have been included for the customer meter element. If you want to include these results in the customer meter, open the Calculation Options and change the property "Calculate Customer Results?" to True. When you compute the model, you will see results for hydraulic grade at the current time step, as well as maximum and minimum results across the model run.
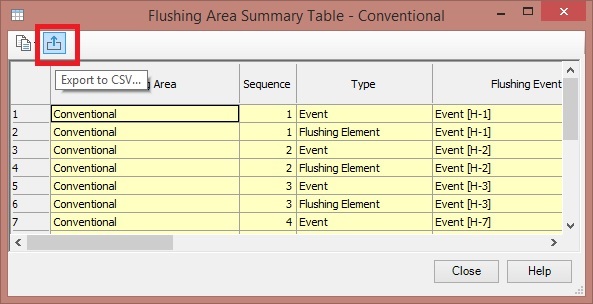
Export Flushing Area Summary Table
Starting with the CONNECT Edition release of WaterGEMS and WaterCAD, you can now export the Flushing Area Summary Table for a given flushing run. The table is exported into a CSV format, which can be opened in Excel, and will include element labels and results. While the table currently used in the Flushing module allows for the operator to include notes, this export feature allows you to have additional flexibility for presenting your data. Once the data is exported, you can format the Excel file to your specifications.

Usability Enhancements [Top of Page]
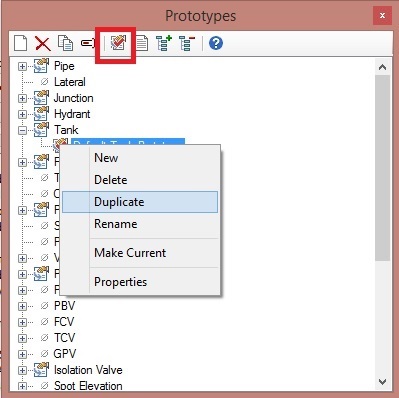
Duplicate Prototypes
The Prototypes Manager now includes the option to duplicate prototypes.
Open on selection from within FlexTable
When you have a FlexTable open, such as the junction FlexTable, you can now select the rows in the table based on the current selection.
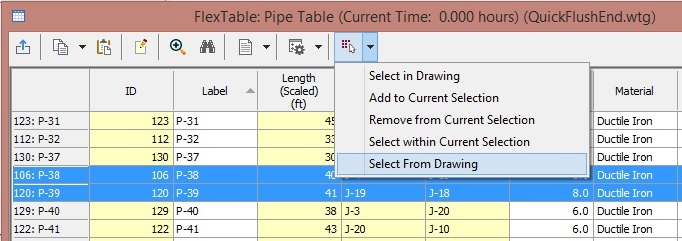
To use the feature:
- Select some elements.
- Open a FlexTable for one of the selected elements and click the drop-down arrow for the “Select in Drawing” button.
- Click the last item, “Select from Drawing”.
Double-click on dropdown list to toggle through values
When editing data in the property grid you can double-click the label to change the value. This applies to Boolean fields (those that show true/false values); reference fields (such as "Zone"); and enumerated fields (such as "Status (Initial)"). When you double-click any of these field types it will cycle through the available values in the drop-down list. Commands like “Edit” for reference fields are excluded during the cycling.
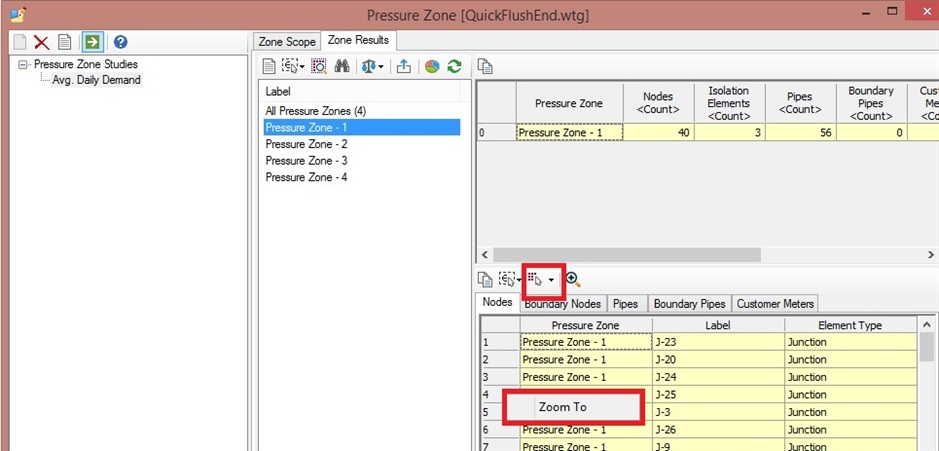
Zoom To and Select in Drawing support in Pressure Zone Manager results
You can now use Select in Drawing functions and Zoom To functions in the Pressure Zone Manager results. The Zoom To function is used by right-clicking on row in the table in the lower right of the dialog. The Select in Drawing button can be found above the table.
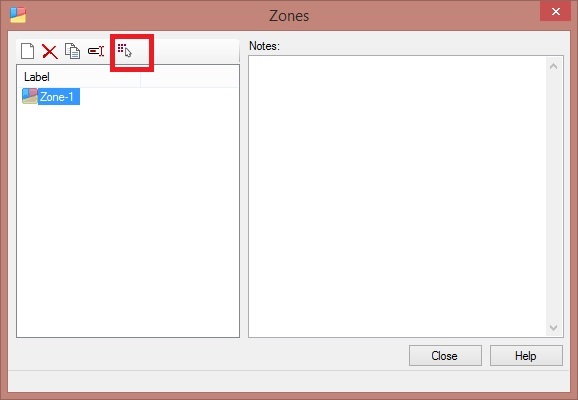
Select in Drawing support for Zone manager
You can can use a Select in Drawing to in the Zone manager to quickly identify elements that are assigned to a given zone.
CONNECT Integration
This release requires the latest version of CONNECTION client. If it isn't already on the computer, it will be downloaded and installed during the product's installation.
After the product installation completes, a CONNECTION client slideshow will display. This provides an introduction to the CONNECTION client, allows you to enter your login information, or create a new account if you don't already have one.
There is a new CONNECTED Project association dialog which allows the default behavior to be set. If you don't want the dialog to appear in the future, then select "Do not notify me again".
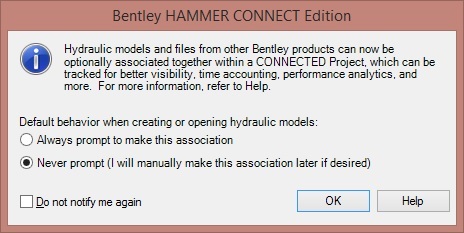
Information on using CONNECTED projects can be found at this link: Associate a CONNECTED Project with a Hydraulic Model.
View Changes
The view can be quickly set to Zoom Extents by double-clicking the middle button on your mouse. For some, this may be done with the scroll-wheel button.
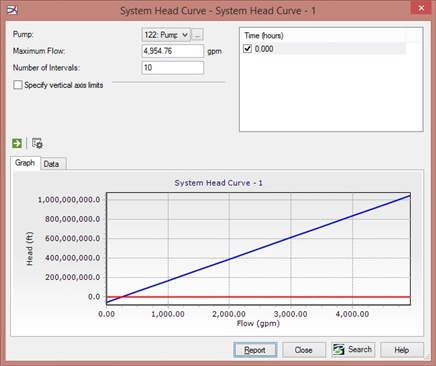
Ability to set vertical axis in System Head Curve
Support has been added so the user can set the maximum and minimum head values in the System Head Curve graph. This can be useful for system head curves for closed system (i.e., no downstream storage). System head curves with no downstream storage generate a highly skewed graph.
By assigning minimum and maximum head values, the graph will be less extreme and more legible, as seen below. To do this, select the checkbox for "Specify vertical axis limits" and enter minimum and maximum head values.
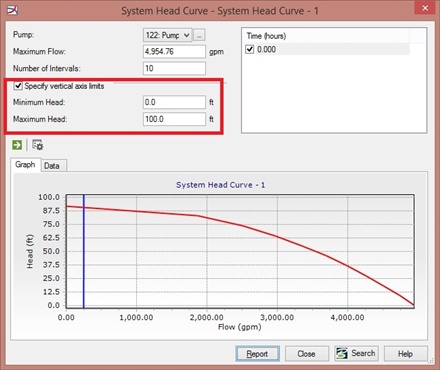
Note that system head curves in closed systems still require the use of pressure dependent demands to get better results, as noted in this link.
See also:
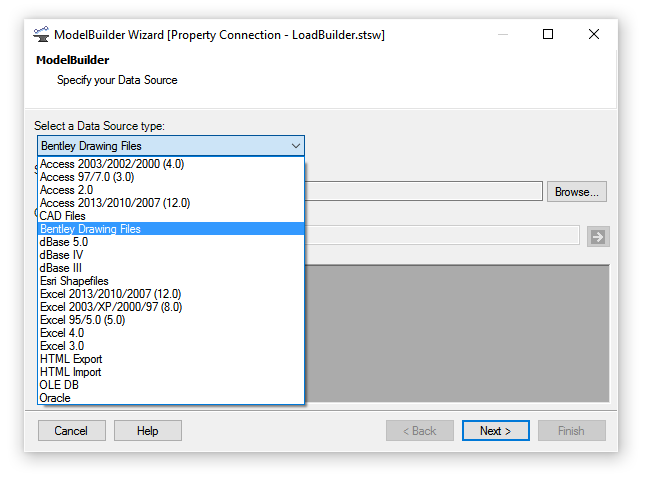
Added support for DGN files in ModelBuilder
ModelBuilder now supports Bentley Drawing File formats (*.idgndb, *.imodel, *.dgn).
Improvements to Assign Isolation Valve to Pipe tool
The Assign Isolation Valve to Pipe tool has been improved. In this tool, the isolation valve will be assigned to the nearest pipe. In a case where the isolation valve is exactly the same distance from two pipes, it will now be assigned to the shortest pipe, rather than the first pipe in the database.
Improvements to handling licensure
If your license feature level (number of pipes) changes, the program will now open the Municipal License Administrator to allow you to select a new license size. This will allow you to quickly select a license size and continue your work without needing to open and close the program to activate the new license.
Inactive pipes no longer count toward the overall pipe count when running a model. For example, if you have a 2,000 pipe license with 2,200 pipes are in your model and 200 are set to inactive the model will compute. Previously, a user notification about the number of pipes in the model exceeds the number of active elements would have been generated.
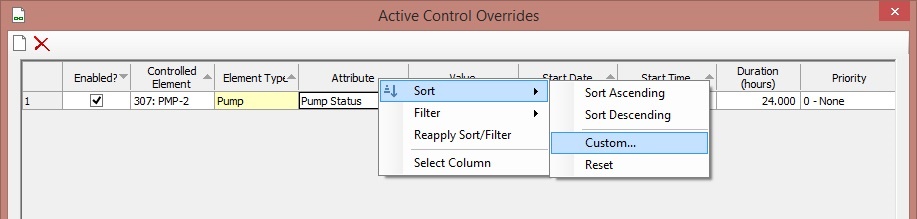
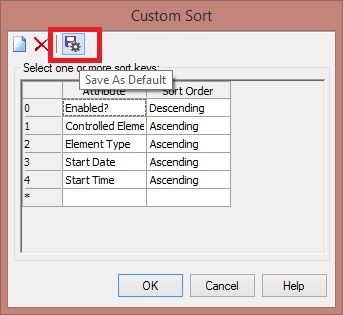
Save Custom Sort of Control Overrides in SCADAConnect Simulator as a default (in build 10.00.00.55)
You now have the ability to save a customized sort of Control Overrides in SCADAConnect Simulator as a default. This default persists for subsequent models using Control Overrides in SCADAConnect Simulator. This will allow you to view the Control Overrides in the same order for a given project.
Clarity improvements to the Municipal License Administrator
The Municipal License Administrator has been improved to clarify that standalone licenses are always available to use, as well as which platforms are available for a given license.
Ribbon Interface for CONNECT Edition products
Product TechNotes and FAQs
OpenFlows Product TechNotes And FAQs
WaterGEMS and WaterCAD TechNotes and FAQs
Downloading OpenFlows / Hydraulics and Hydrology Software
Software installation order
Cumulative patch set information
Set up notifications for new versions and patch set releases
| |
Original Author: |
Scott Kampa |
|