| |
Applies To |
|
|
| |
Product(s): |
WaterGEMS, WaterCAD |
|
| |
Version(s): |
CONNECT Edition, V8i |
|
| |
Area: |
Calculations |
|
Problem
In a model with no downstream boundary condition (reservoir or tank) why do I see strange numbers when attempting to graph the system head curve of my pump, or see the below error?
"For at least one flow the system head couldn't be calculated."
Why does the system head curve for a closed system look strange?

Solution
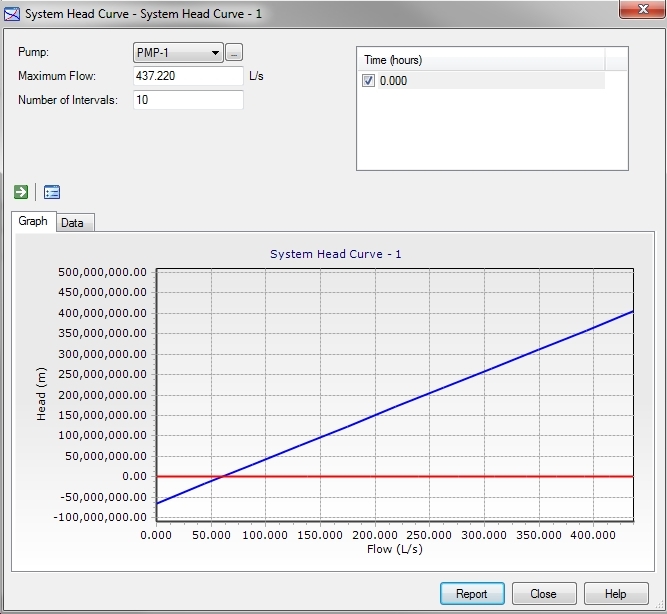
The system head curve option is invalid for this condition. The scale exaggeration throws off the graph--really what we're seeing plotted is a near-vertical line for the system head curve. As graphed, there is a huge change in head for a small change in flow. Only the single point at which the pump is operating (the point where the system head curve and the pump curve intersect) is valid. Although we can accurately show the actual pump operating point, we are unable to generate a valid system head curve for the condition represented in the model. This isn't a problem with the software, but rather a limitation dictated by the condition being represented.
The screenshot of the system head curve seen above is what the graph with the exaggerated scale looks. Notice the large negative values on the Y-Axis.
Additional background on the WaterGEMS modeling algorithm can help explain this. WaterCAD and WaterGEMS are demand-based calculations, unless flow emitters or pressure-dependent demands (V8 only) are being used. This means the modeler has to explicitly define the demands and the program runs the calculation to see the resulting flows and pressures that result when these demands are met. However, because of the way the pressure-based calculation works there needs to be some interpretation on the part of the modeler regarding the validity of the results. For instance, maybe the modeler runs a scenario for a very high demand, like a fire flow demand. The resulting calculation may show very negative pressures at some of the nodes for this condition, because the negative values are required to satisfy the energy equation for the specified demands. However, on reviewing the calculations, the modeler sees these negative pressures and realizes that, in reality, these pressures couldn't occur. Instead, the flow actually available at the fire flow junction will be less than what the modeler specified as the fire flow demand.
Concerning system head curves: generation of this curve requires that the program have the flexibility to look at how the system reacts to a "range" of flows through the pump. In a system with storage downstream of the pump, the model is able to look at this range of flows because the downstream system has a way to deal with different flow rates being forced into it. To model flows on the system head curve (i.e., flows through the pump) in excess of the total node demand, any excess water can be used to fill the tank or reservoir. To model flows on the system head curve less than the total node demand, the difference in flow can be made up by the tank or reservoir. To sum up, when a system has storage (reservoir or tank) downstream of the pump, it is possible to create a system head curve because it is possible for the pump to push a "range" of flows into the system.
In a situation in which the demands are fixed and there is no downstream storage/reservoir, this means that there is only one possible flow through the pump, which is equal to the sum of all the demands in the system. The only thing the model can compute is the single operating point of the pump--it is impossible to generate a "curve".
Note: If the tank on the upstream or downstream end of the pump is empty, you will see results like this as well. If a tank is empty, the results will not be valid.
In order to resolve this problem what you need to do is create and assign a pressure dependent demand (PDD) function to all of the junctions with demands in your model that are downstream of the pump you're creating to get the system head curve for. This wiki TechNote will describe how to create pressure dependent demands and add them to your model:
Setting Up Pressure Dependent Demands
Note: the pressure dependent demand function should be configured to have no threshold limit. This way, with increasing pressure the PDD demand can be increased above the base demand of the corresponding scenario to calculate the system head curve for flows larger than the total demand of all demand nodes in the closed network. Therefore, using a piecewise linear PDD function is not recommended because this function is limited to the largest demand percentage in the PDD curve.
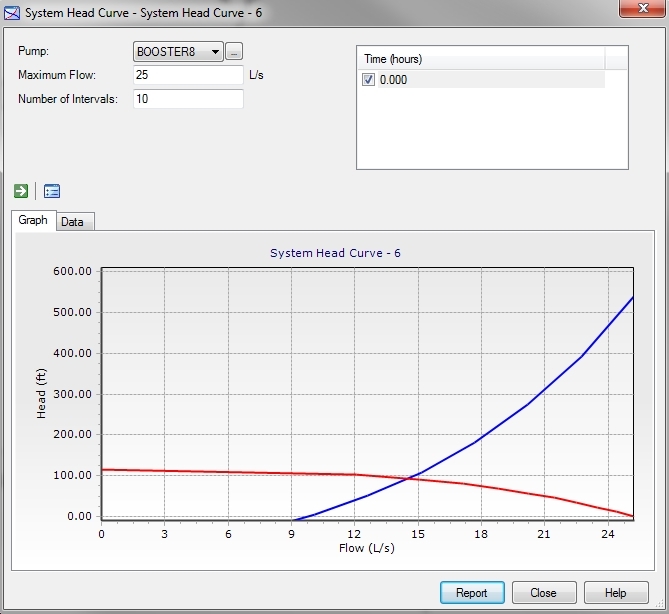
Once this is done you should get an accurate representation of your system head curve graph:
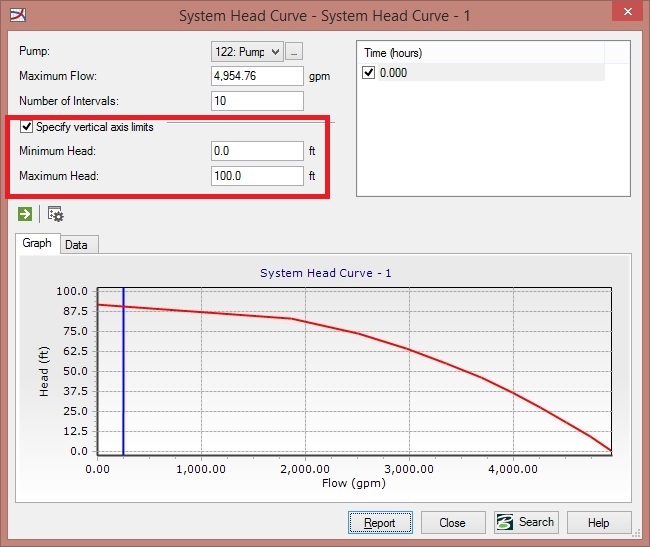
Set Vertical Axis
Starting with the CONNECT Edition release of WaterGEMS and WaterCAD, you can now adjust the vertical axis for the system head curve. This can be especially useful for cases where there is no downstream storage. While the system head curve is not valid for cases with no downstream storage if you are not using pressure dependent demands, by assigning minimum and maximum head values, the graph will be less extreme and more legible, as seen below. To use this feature, select the checkbox for "Specify vertical axis limits" and enter minimum and maximum head values.
Note: in the combination pump curve tool, you can accomplish this using the "chart options" button above and to the left of the graph, click "Axis", select "left axis", then change the value for the min and max tabs.
See Also
A forum discussion about this issue
System Head Curves in WaterGEMS and WaterCAD
Pump Selection for a Closed System
Paper: Walski, Hartell and Wu, 2010, "Developing system head curves for closed systems" JAWWA, 102:9:84, September.