| Product(s): |
WaterGEMS and WaterCAD |
| Version(s): |
V8i SELECTseries 5 (08.11.05.61) |
| Area: |
N/A |
Overview
The SELECTSeries 5 release of WaterGEMS and WaterCAD includes many new features and improvements. This TechNote explores each change.
-Support for 64-bit Operating Systems and Newer Platforms
-Customer Meter Element
-External Customer Meter Data manager
-Export model to notebook computers and tablets with Bentley Map Mobile
-SCADAConnect Simulator
-SCADA Element
-Pipe Renewal Planner -Hydraulic Risk Score
-Time of day patterns added to the energy management tool
-Multi-Species Analysis
-Customizable Alerts (User Notificaitons)
-Customizable Alarms
-Intra-Trial Status Messages
Note: A free Webinar covering these new features is available from this link.
Support for Newer Platforms
Bentley WaterGEMS and WaterCAD V8i SELECTSeries 5 now supports the following:
- Windows 8 (32- and 64-bit), Windows 7 (32- and 64-bit), Windows Vista SP2 (32- and 64-bit)
- AutoCAD 2014 and AutoCAD 2015 (32-bit and 64-bit)
- Microstation V8i SELECTseries 3 (08.11.09.xx)
- ArcGIS 10.2 and ArcGIS 10.2 SP1 SP5 and ArcGIS 10.1
- ProjectWise V8i (build 08.11.11.111)
Note: Older platforms of MicroStation ArcGIS may also integrate with Bentley WaterGEMS/WaterCAD. These versions have not been fully certified. Bentley WaterGEMS/WaterCAD should also be compatible with older versions of ProjectWise.
In addition, while Bentley WaterGEMS and WaterCAD may install and work on Windows XP, the program is not certified or supported for that operating system. This is because Microsoft has also discontinued support for Windows XP as of April 2014.
Customer Meter Element
A new element type has been added, to support a greater level of detail. Each customer can be modeled and tracked as a separate node element. More information below:
http://communities.bentley.com/products/hydraulics___hydrology/w/hydraulics_and_hydrology__wiki/19455.customer-meter-elements-and-the-external-customer-meter-data-manager
External Customer Meter Data manager
A new External Customer Meter Data manager have been added so that external source data can be added to the Customer Meter element. This allows the user to see detailed information about the location that the Customer Meter element represents. More information below:
http://communities.bentley.com/products/hydraulics___hydrology/w/hydraulics_and_hydrology__wiki/19455.customer-meter-elements-and-the-external-customer-meter-data-manager
Export model to notebook computers and tablets with Bentley Map Mobile
Bentley WaterGEMS/WaterCAD models can now be exported to Bentley Map Mobile for usage on notebook computers and tablets. This makes it possible to view WaterGEMS/WaterCAD models on Android, iPad & iPad mini tablets; you just need to have the Bentley Map mobile application. The new tool has been introduced-Bentley Map Mobile, which publishes Map Mobile i-model, available in file export options. Even background files can be viewed but individually in the view filter list in map mobile.
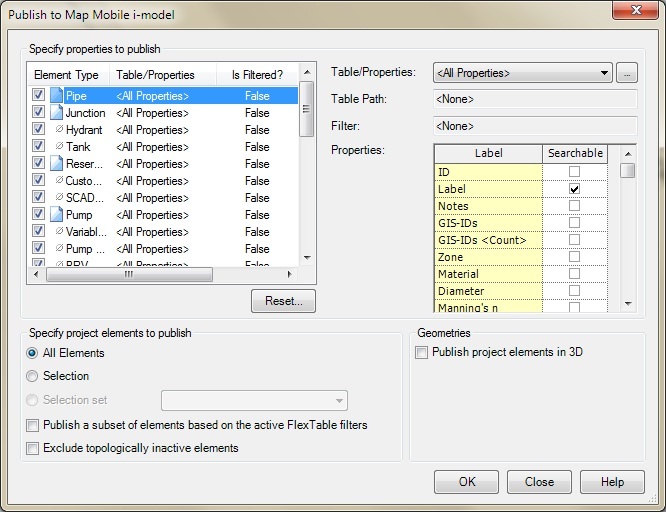

This tool is beneficial for the users who don’t have Bentley software; the models can still be sent to them so that they can viewthe models on their Android, iPad & iPad mini tablets.
SCADAConnect Simulator and general SCADAConnect Improvements
A new SCADAConnect Simulator has been added to WaterGEMS that greatly improves the usability and performance of WaterGEMS in conjunction with SCADA systems. SCADAConnect Simulator provides a way for users to modify and run a model scenario from a very simple user interface without the need to interact with some of the more sophisticated features of WaterGEMS/CAD. In order to run the simulator, it is necessary to have a model with an existing Extended Period Simulation (EPS) scenario already created (and labeled as SCADA).
For detailed information on SCADAConnect Simulator, see the following link:
https://communities.bentley.com/products/hydraulics___hydrology/w/hydraulics_and_hydrology__wiki/16992.scadaconnect-simulator
SCADA element
A SCADA element is an element created in order to link model elements. The SCADA element must be linked to a model element and can also be linked to some type of external signal. Each SCADA element has only one property so that an element with multiple properties must have one element per property (e.g. a pump with suction and discharge pressure and flow would have three SCADA elements).

These elements can be used to display external data in a model or set up alarms for model results.
From the layout tool bar click on SCADA Element icon and then click on the drawing next to the element of interest. One SCADA Element can be mapped to one SCADA tag/item so if there are multiple signals for an element multiple SCADA Element are required, for e.g. if a pump has two signals from SCADA representing flow and pressure then to map both of the signals there must be two SCADA Elements.
The SCADS element can be graphed like other node elements. In addition, color coding and annotations can be included as well.
For detailed information on how these functions work, please see the following link:
https://communities.bentley.com/products/hydraulics___hydrology/w/hydraulics_and_hydrology__wiki/17461.new-scada-element-annotation-and-reporting-abilities
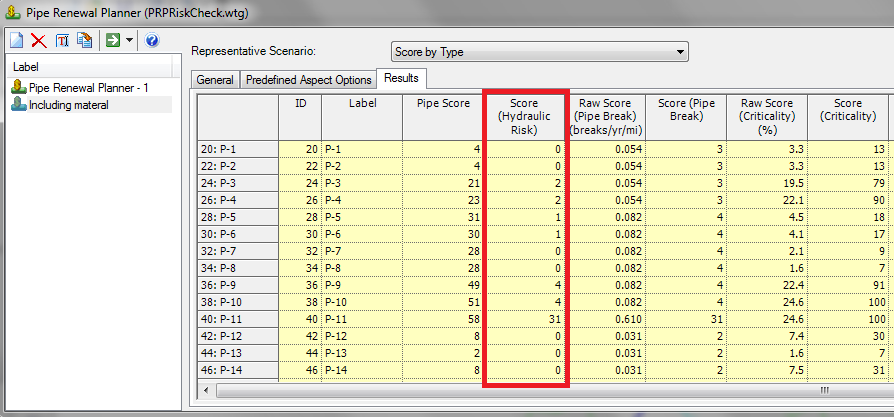
Pipe Renewal Planner - Hydraulic Risk Score
Pipe Renewal Planner is a decision support tool that provides utility owner/operators with a quantifiable and reproducible best practice for optimizing the replacement and rehabilitation of water mains. As a condition assessment tool, Pipe Renewal Planner ranks pipe links based on several aspects, including property- and performance-based criteria.Benefits that result include improved asset planning, increased distribution capacity, and maximum returns on capital expenditures.
The risk calculation is a new tool for pipe renewal planner, which helps to further evaluate the risk from a failure. The accepted industry formula for doing this is:
Risk = Likelihood x Consequences
In pipe renewal planner we call this risk “Hydraulic Risk Score” and it will be the product of the Pipe Break Score, which is an indicator of 'Likelihood' and Criticality, which is an indicator of 'Consequences' divided by 100. (Hydraulic Risk Score = Pipe Breaks Score x Criticality Score / 100) .
The prerequisites to running the hydraulic risk are to make sure you have computed the pipe break score and the criticality. If you need more information on how to run a criticality analysis you can find that in the wiki below:
http://communities.bentley.com/products/hydraulics___hydrology/w/hydraulics_and_hydrology__wiki/running-a-criticality-analysis
For more information on how to run a pipe break analysis please see the wiki link below:
http://communities.bentley.com/products/hydraulics___hydrology/w/hydraulics_and_hydrology__wiki/running-pipe-break-analysis
After you click the new button in PIpe Renewal Planner Hydraulic Risk is one of the 4 default aspects that is populated on the General tab. The next step to using it would be to choose whether you are going to to evaluate the risk for the entire network or for a selection set of pipes. Then you can assign a weight to the aspect and finally you can choose whether you use that aspect by checking the check box in the 'Use' column to calculate the value for this run.

Hydraulic Risk is reported in the results tab of pipe renewal planner in the “Score (Hydraulic Risk)” column.
Time of day patterns added to the energy management tool
The energy management tool is used in order to estimate what energy costs are going to be in the future or to make design choices that result in energy efficiency. This tool performs multiple energy analyses with alternative pricing for pumping stations in different parts of the system, considers the effects of storage on cost of running the system, and returns many results for operational strategy comparisons. Some of these operational strategy comparisons include daily cost, usage cost, overall energy used, overall unit cost, average efficiency, and so forth. You can read more about the energy management tool in this wiki article:
http://communities.bentley.com/products/hydraulics___hydrology/w/hydraulics_and_hydrology__wiki/energy-cost-analysis-in-watergems-v8i-selectseries-4
As of SELECTSeries 5 the energy management tool is now equipped to handle time of day patterns that are found in the energy pricing window. This window is accessible through the power meters tab by clicking the ellipsis button in the energy pricing column (see red box below).
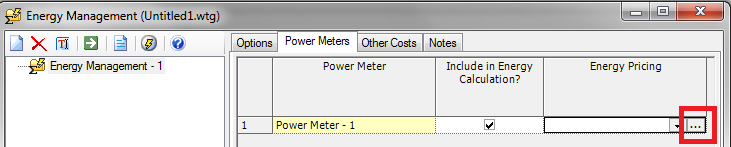
The next step to using the time of day patterns for multiple peak charges is to click the check box on the bottom of the energy pricing window titled, “Include Peak Demand Change?” (see red box below). After that you click the check box titled, “Use Multiple Peak Charges for Energy Management?” (see green box below). Doing this will enable the “Edit Multiple Peak Changes…” button (see yellow/orange box below) and once this is clicked the window you enter the peak charges in

The multiple peak charges window, pictured below, offers the ‘Peak Charge Type’ to be entered as either a “Clock Time” that allows you to enter the start and end time using the actual clock time (e.g. 1:35 AM start time & 11:51 PM end time) or “Simulation Time” that uses the start time and end time in hours (e.g. 13 hours start time & 34 hour end time). This window also has a third column where you enter the peak demand charge that you will be using in units of $/kilowatt or $/horsepower. For additional information on how to change units and formatting please see this link below:
http://communities.bentley.com/products/hydraulics___hydrology/w/hydraulics_and_hydrology__wiki/8169.changing-units-or-converting-units-for-elements

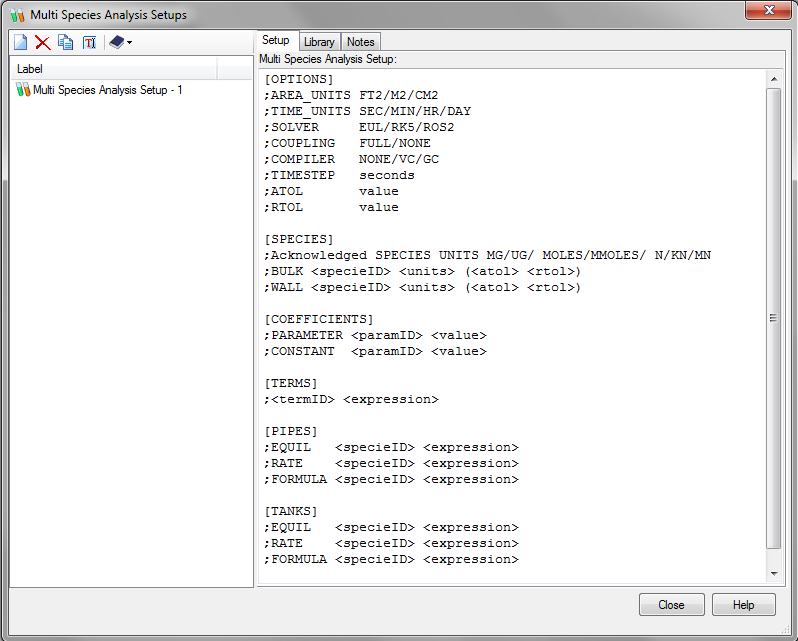
Multi-Species Analysis
Using constituent analysis, a user can track a single constituent through a water distribution system, provided the constituent behaved according to one of the kinetic models (e.g. first order decay). However, some constituents cannot be modeled this way because they are involved in significant multi-species reactions or their kinetics do not fit one of the existing models. To handle these cases, WaterGEMS provides Multi-species Analysis, based on the EPANET-MSX model with a WaterGEMS user interface. Below is what the Multi-Species manager looks like:
In order to use multi-species analysis in WaterGEMS, in addition to the usual EPS input, the user must provide the following:
- Generic options such as water quality time step size
- Species name and mass units
- Reaction rate coefficients either globally or pipe by pipe
- Rate and equilibrium equations for pipes and tanks
- Sources of each species and relevant time patterns
- Initial concentration of species
- Reporting options
These values are entered as text in the “Multi-species Analysis Setup” and “Multi-Species Model Configuration” using the syntax described below. For a multi-species scenario, the calculation options are set to Multi-species analysis (see the help documents titled “Multi-species Analysis Setup” and “Multi-species Model Configuration”). The distinction between Setup and Configuration is that the setup contains values describing kinetics and can be used with any model while the configuration contains values for sources and overrides that are specific to the current model.
The data for a multi-species analysis is divided into sections as described below:
[TITLE] adds a descriptive title to the data set
[OPTIONS] sets the values of computational options
[SPECIES] names the chemical species being analyzed
[COEFFICIENTS] names the parameters and constants used in chemical rate and equilibrium expressions
[TERMS] defines intermediate terms used in chemical rate and equilibrium expressions
[PIPES] supplies the rate and equilibrium dynamics in pipes expressions that govern species
[TANKS] supplies the rate and equilibrium dynamics in storage tanks expressions that govern species
[SOURCES] identifies input sources (i.e., boundary conditions) for selected species
[QUALITY] supplies initial conditions for selected species throughout the network
[PARAMETERS] allows parameter values to be assigned on a pipe by pipe basis
[PATTERNS] defines time patterns used with input sources
[REPORT] specifies reporting options
The values for most of these sections are entered under model setup while the sections on Sources, Quality and Parameters are model specific and are described under model configuration.
This help topic provides the steps to run a multi-species analysis in WaterGEMS. For more detailed background and theory, the user is referred to the EPANET-MSX manual.
To enter the data for a multi-species run, the user must create a multi-species setup by selecting Component > Multi-Species Analysis Setups. Pick New to create a setup.
The user can also Delete, Copy, Rename or Import/Export setups from a library. The exact syntax for the setup is provided in help topic titled, "Multi-Species Analysis Setup". To run a multi-species analysis, the user must set the Calculation Type in the Calculation Options to "Multi-Species Analysis". This opens up a category at the bottom of the calculation options where the user selects the Multi-Species Analysis Setup using the drop down box from the list of those created above.
The results of a multi-species analysis run are available using the property grid, graphing, annotation, color coding just as any other WaterGEMS results.
Customizable Alerts (User Notifications)
This is has been a highly requested feature for our software products that will allow the user the flexibility to establish their own alerts or user notifications. These alerts are settings the user will create that will trigger messages when a certain criterion value has been exceeded for any type of hydraulic modeling element. Alerts are calculated at the time the scenario is run, not when the alerts are entered.
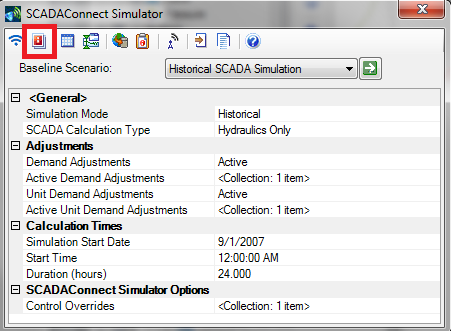
Alerts are setup in the Alerts manager window, which can be accessed through the “Components” menu (Components > Alerts or as a button from the SCADA Connect Simulator manager.
The Alerts manager window:
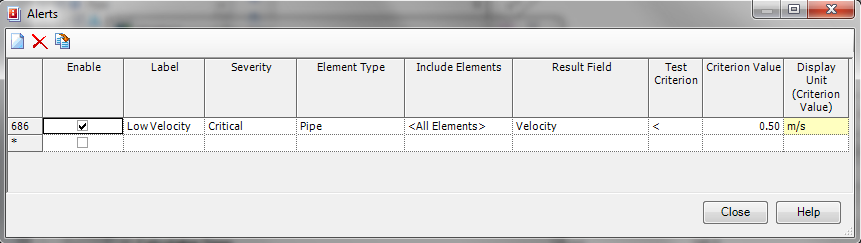
From the buttons at the top of the dialog, the user can create new alerts, delete existing alerts or duplicate an alert.
The button location for alerts on the SCADA Connect Simulator window:
Alerts can be used for various objectives such as letting the user know that junction elements that fall out of a given pressure range or finding a pressure pipe that is below or above a given velocity.
The steps for creating a new alert are as follows:
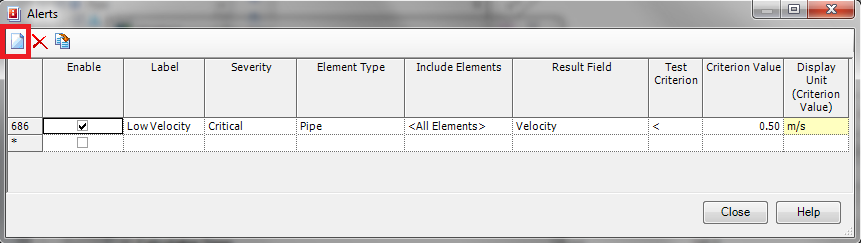
1) Click the new button highlighted by the red box in the screen shot above
2) Click the check box in the “Enable” field to enable/disable the alert for the run
3) Type in the name for this alert in the ‘Label’ field
4) Set the severity of the alert using the drop down menu to Critical (red), Warning (yellow), or Informational (blue).
5) The “Include Elements” column allows you to choose from a selection set of elements that you have already created or use the alert for <All Elements> in the current scenairo
6) “Result Field” defines the result property that you will be choosing to create the alert from. These properties vary depending on which element type that you choose.
7) The “Test Criterion” sets the operator that you are choosing for this alert. The operators are greater than (>), less than (<), not equal to (< >), equal to (=), greater than or equal to (> =), and less than or equal to (< =).
8) The “Criterion Value” field allows you to define the value your alert will be based on and the “Display Unit Criterion Value” field is a display field (read-only) that shows you the current units for the “Result Field” that you have selected. If you’d like to change this value you can do so using the instructions from this wiki article:
https://communities.bentley.com/products/hydraulics___hydrology/w/hydraulics_and_hydrology__wiki/8169.changing-units-or-converting-units-for-elements
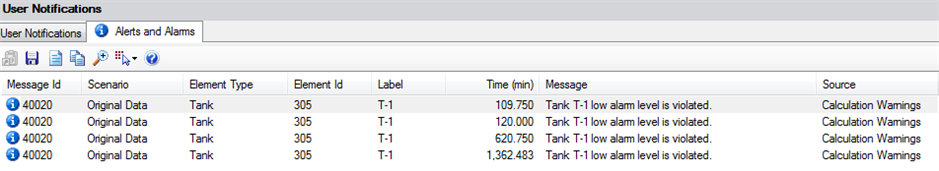
The alert messages can be found with the user notifications under Analysis > User Notifications by choosing the Alarms and Alerts tab.
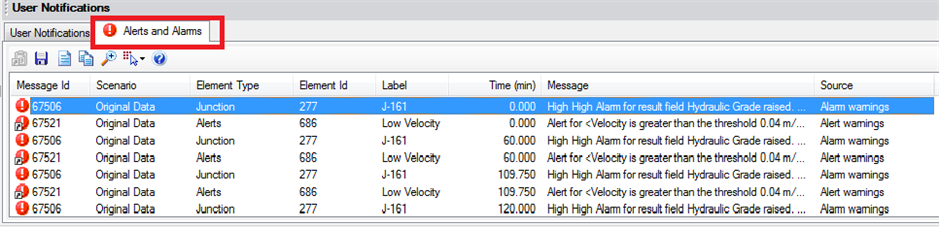
Most of the columns are self-explanatory and if you are familiar with the user notifications window this is designed the same way. The color of the message is an indication of its severity. Then you are given the Message Id followed by the name of the scenario, element type, element Id, element label, time the alert occurred, message details, and the source the alert was generated from.
When multiple elements trigger alerts, these can be viewed by picking the Details (first button on top of table) to view multiple alerts at a given time. The second button enables the user to save the alarms and alerts in a csv file. The third button generates a report that can be printed. The fourth button copies the highlighted alert (see the example below)
40020 "Base" "Tank" "456" "T2" 16.59 "Tank T2 low alarm level is violated." Calculation Warnings
The fifth button zooms to the element associated with the highlighted alert. The sixth button selects the highlighted element in the model for the alert you have highlighted and the final button opens the Help documentation.
Customizable Alarms
Alarms are similar to alerts, but differ in the fact that they are only used for the SCADA element and for tanks. As a property of a SCADA element, alarms are intended to mimic the response of alarms in a SCADA system.
Alarms can be accessed through the properties of these elements and look as follows in the properties window:
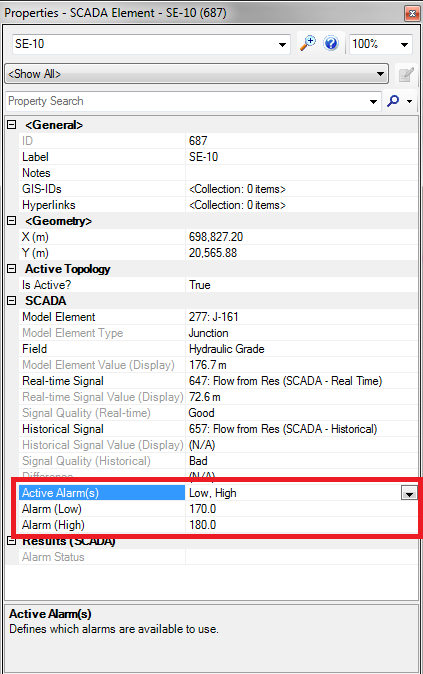
An alarm is enabled by setting the “Active Alarm” field and choosing one of the options from the drop. The options are <None> ‘Low, High’, ‘Low’. ‘High’, and ‘Low-Low, Low, High, High-High’. The ‘Low-Low, Low, High, High-High’ alarm type will allow you to set 4 alarms. The first is the low-low that should be the lowest value you can have for the associated element. The low is a value that lets you know you are getting close to the low-low value. The high-high and the high alarms are the opposite of the low-low and low values for the given element.
After choosing you active alarm setting the corresponding fields will appear below the active alarm where you will enter your alert values. For example, if you choose the ‘High’ active alarm you will only see a row below the active alarm for entering that high alarm. If you choose the ‘High’, and ‘Low-Low, Low, High, High-High’ you will see 4 rows below the active alarm to enter each of those values.
Alarms for tanks are enabled by choosing ‘True’ for either the “Use High Alarm?” or “Use Low Alarm?” and then setting the associated value in the elevation (low alarm)/elevation (high alarm) field once it is exposed.

Alarms are also displayed like alerts in the tab on the User Notifications window:
Intra-Trial Status Messages
A new tab has been added to the calculation summary, to display status changes between calculation trials. Prior to SELECTseries 5, you would need to open the .RPT file in a text editor and locate the desired timestep to see these details. This can be useful in troubleshooting timesteps that are unbalanced or when a control conflict is suspected. For example if you have a pump turn on and off based on pressure at a junction, it's possible that the act of turning on the pump may instantly trigger the pump to turn back off based on the pressure set points. In this case, the time step may balance on a condition that may appear to be at odds with the control. In this case, you will notice the pump changing status in the Intra-Trial Status Messages tab, when clicking on the time step in question. Another common example would be dynamic valves like PRVs and PSVs. For example a PRV becoming active may cause another PRV to become active, which then causes the first one to become open, and so on. If this occurs, you'll see the PRVs show up multiple times in the intra-trial status messages tab.

See Also
What's New in WaterGEMS, WaterCAD and HAMMER V8i SELECTseries 5 (Webinar)
Improve Hydraulic Modeling of Customers and their Water Demands (Webinar)
Product TechNotes and FAQs
OpenFlows Product Tech Notes And FAQs
Hydraulics and Hydrology Forum
External Links
Bentley SELECTservices
Bentley LEARN Server