| Product(s): |
WaterGEMS, WaterCAD, SewerCAD, SewerGEMS |
| Version(s): |
CONNECT Edition, V8i |
| Area: |
Layout and Data Input |
Problem
Is there any way to graphically view which node each customer demand was allocated to, after running Loadbuilder? (for example the Nearest Node method)
Solution
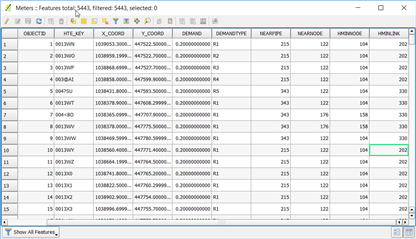
When loads are allocated to nodes using LoadBuilder, the best way to see the allocation would be to look at the "HMINNODE" or "HMINLINK" field in your shapefile or geodatabase. After running Loadbuilder, it creates this field in the data source to keep track of which node (the ID, not the label) each point was allocated to. So, you'd have to look at the ID of the node that the demand is on, then look up that ID in the HMINNODE field to see which point the demand came from.
Note that the main reason why Loadbuilder creates this field is so that you can check the "use previous run" check box in Loadbuilder, which tells it to use that "HMINNODE" and/or "HMINLINK" field instead of having to recalculate spatial proximity (for subsequent Loadbuilder runs.)
Note: multiple loads of the same type (residential, commercial, etc) will be lumped together into a single load/demand entry in the load/demand collection of the assigned node.
Consider Property Connections
A solution to visualizing the allocation of loads would be to consider importing the customers/connections as the Property Connection node element, which connects to the pipe via a tap and lateral. This enables you to add all the details of the individual property connection locations so that you can visualize and include other details. You can use ModelBuilder to import the property connections based on your billing meter shapefile, then use LoadBuilder to connect the property connections to the nearest node/pipe and create the taps and laterals. See more here:
See Also
How do each of Loadbuilder method works?
Troubleshooting and Understanding LoadBuilder