| Product(s): |
HAMMER |
| Version(s): |
08.11.XX.XX, 10.XX.XX.XX |
| Area: |
Modeling |
Problem
How can you view the minimum and maximum transient pressure or hydraulic grade results in a HAMMER model?
Solution
The maximum and minimum pressures for a transient event are available for elements can be found in a number of locations, as described below.
Properties dialog
You can find the maximum and minimum transient pressure for a given junction in the model by double-clicking on the junction to open the Properties grid. Find the section "Results (Transient)" and then the items "Pressure (Maximum, Transient)" and "Pressure (Minimum, Transient)".

FlexTables
You can also find this information available in the FlexTables. Go to View > FlexTables, and double-click the element table you wish to view.

If "Pressure (Maximum, Transient)" and "Pressure (Minimum, Transient)" are not already in the table, you can add them by clicking the Edit button at the top of the FlexTable. Information on editing the FlexTables can be found at this link: Customizing FlexTables for viewing and reporting data - Moving, adding, and removing columns
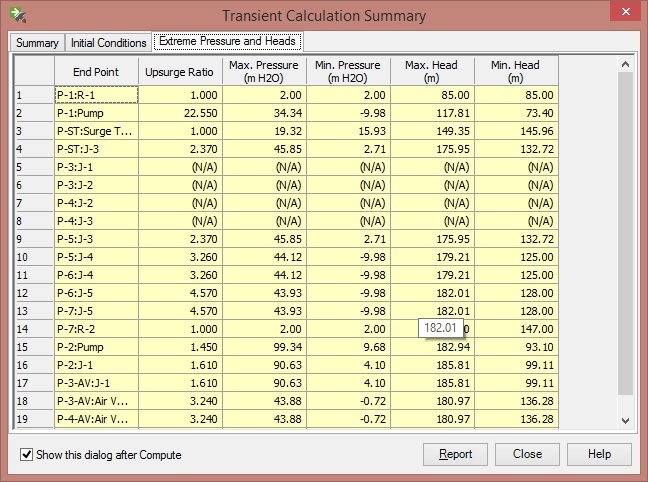
Extreme Pressure and Heads table
The Extreme Pressure and Heads table would be another option. This is found in the Transient Calculation Summary that displays after computing the transient run. It is also available from Home > Transient Summary or Analysis > Transient Summary in HAMMER CONNECT Edition, or Analysis > Transient Calculation Summary in HAMMER V8i. In the Extreme Pressure and Heads tab you can find maximum and minimum values for pressure and hydraulic grade for points in your model.
Transient Profile
If you want to see a graphical representation for the maximum and minimum pressures along a profile, you can view this using the Transient Results Viewer. Open the Transient Results Viewer and go the Profiles tab. Change the Graph Type to use Hydraulic Grade or Pressure as needed and click the Profile button.
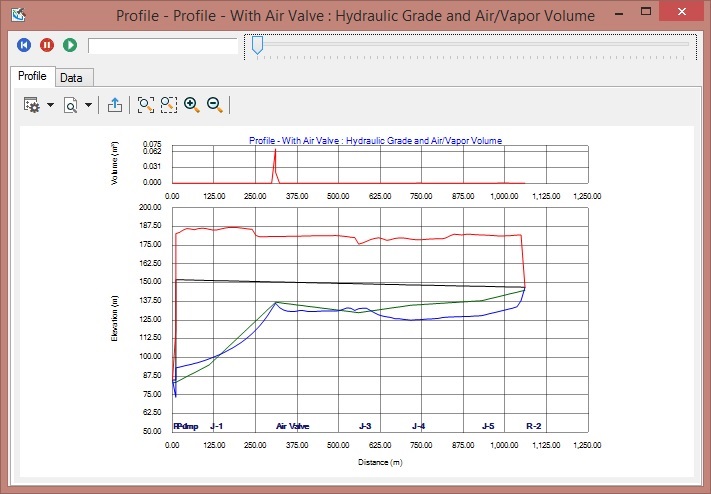
A pressure envelope is displayed that shows the current hydraulic grade or pressure, as well as the minimum and maximum values in blue or red, respectively. This can be useful if you want to see how the minimum or maximum hydraulic grade or pressure change across the system.
See Also
What do the different colored lines in the Transient Results Viewer profile represent?
Results from the Extreme Pressure and Heads table are different from results found in transient profiles