| |
Applies To |
|
|
| |
Product(s): |
WaterGEMS, WaterCAD |
|
| |
Version(s): |
V8i, CONNECT Edition |
|
| |
Area: |
Modeling |
|
| |
Original Author: |
Sushma Choure, Bentley Technical Support Group |
|
Overview
The purpose of this technote is to discuss how to use Darwin Calibrator to perform Leakage Detection.
Background
How leakage detection works?
Leak detection works by adjusting the emitter coefficient (a pressure dependent demand) at nodes in order to get the model to match the field data. A Genetic Algorithm is used and you can find more details about the underlying methodology in the Help documentation, such as the topics entitled "Competent Genetic Algorithms".
- Leakage detection is the main criteria in the water loss management.
- You can perform leakage detection using tool Darwin Calibrator in Bentley WaterGEMS.
- Using Darwin Calibrator you can predict the location and size of the water loss.
- To know about format of the input data required for Leakage detection, please search by phrase – Importing Field Data into Darwin Calibrator Using Modelbuilder.
- Once you have detected the leakage nodes, you can use Criticality tool to repair the leaks.
- Or you can use Pressure Dependent Demands to minimize the leaks in the system.
Note : Along with this technote you will find attached model used to explain Leakage Detection Using Darwin Calibrator & the input data files using Excel Format.
Tips for Water Loss Management
As an introduction to water loss management, it is advisable that you read the following article before embarking on a leakage detection study: Tips for Water Loss Management and Leak Detection
Video demonstration
The following videos are available to help you learn how to perform leak detection:
(quick overview) Locate sources of non-revenue water usage with Darwin Calibrator in WaterGEMS
(training workshop) WaterGEMS Advanced Part 14: Workshop 7 (Leakage detection)
Observing leakage over the time with the help of graph using the attached model for a particular element:
For this example we have field data of flow through pipe P-13, which we will compare with the model results. (See attached model)
- Create graph for P-13. (Right click on P-13>Graph)
- Go to observed data tab>create new.
- You can directly copy/paste data from the spreadsheet/import .txt file or enter data manually.
- Once entered the observed data, the graph should look like this.
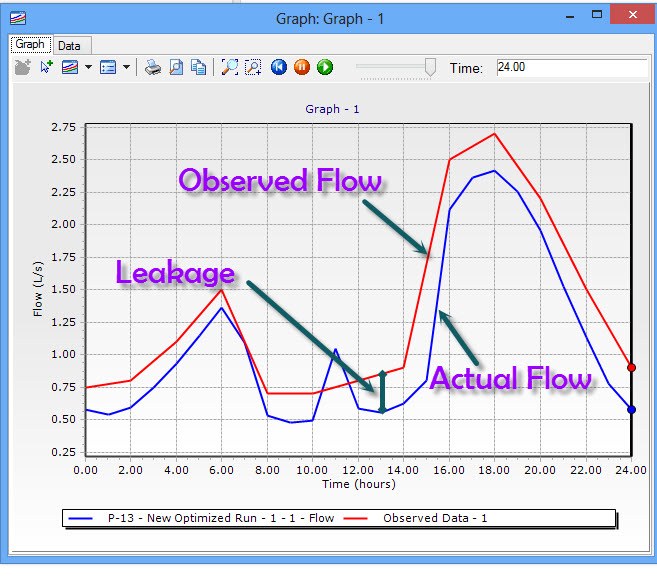
The graph shows the actual flow for Pipe P-13 at various time steps & the observed flow on the field. With the help of this graph you can visualize the leakage at the determined locations, by using the actual flow in the model Vs. observed flow on the field. The difference between the actual flow and the observed flow is the leaked flow into the system.
Calibrating the model to observe the leaks in the model
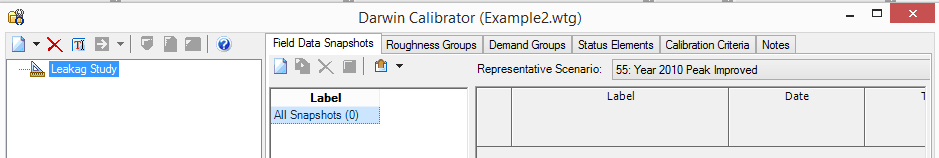
Go to Analysis>Darwin Calibrator>Create new Calibration Study>Rename it as Leakage Study.
Preparing data for importing the field data snapshots
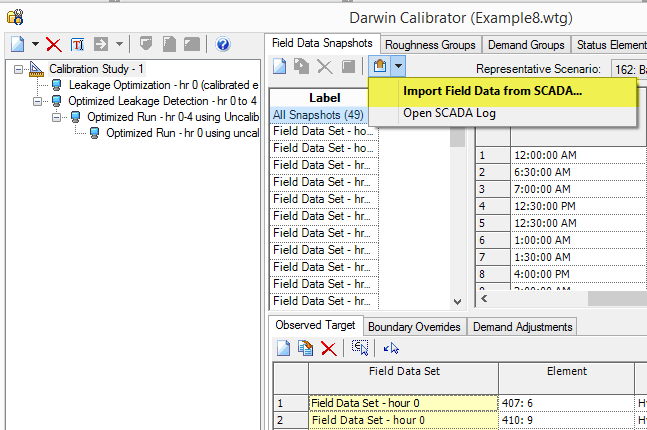
There are several ways of importing the field data into Darwin Calibrator.
- Using SCADA
You need to have SCADA element present in the model for importing SCADA data.
2. Using other file formats as
- Microsoft Excel
- Oracle database
- Microsoft access database
Example of data format required using Microsoft Excel
Please follow the steps in the below article to import snapshots and observed targets from an Excel spreadsheet using ModelBuilder:
Importing Darwin Calibrator Field Data using ModelBuilder
Setting up calibrator study for leakage detection
To prepare, first go to the Demand Groups tab to create a group of demands>create new>Select edit button from Element IDs column>select elements from drawing.You can create multiple demand groups as per different pressure zones/Material groups/Diameter groups in the model. ( Please see technote of Darwin Calibrator to know how to create demand groups)
- Create new optimized run>Rename it as Leakage Detection.
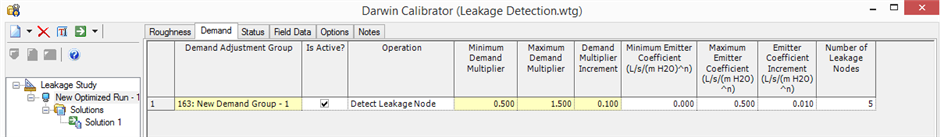
- In the Demand tab, select Detect Leakage Node in the operation column.
- Enter the following settings
- Minimum Emitter Coefficient = 0
- Maximum Emitter Coefficient = 0.5
- Increment = 0.01
- Number of Leakage Nodes = 5
Note: You can change the emitter coefficient values as per the amount of leakage.
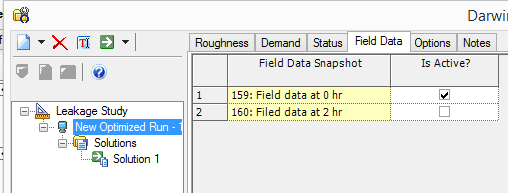
- Go to field data tab, here you can select time steps you want to calibrate, we will select 0 hr for this run. Also you can run the calibration with different combinations of time steps, or all time steps in one go.
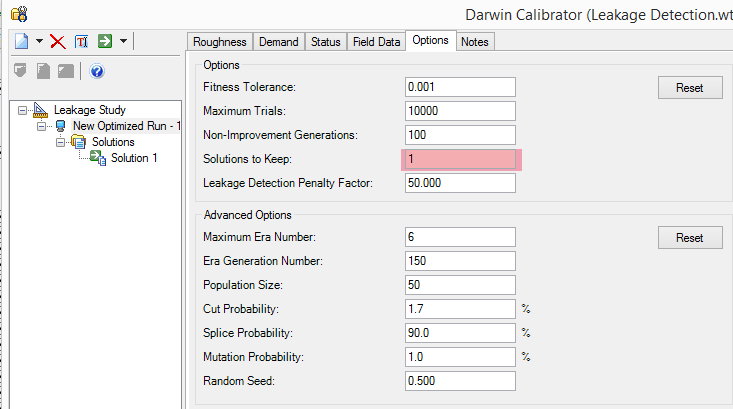
- Compute the Darwin Calibrator once all set. You can increase the number of solutions by going to options>Optimized run.
- Click on the solution 1 in the left side of the window, you can see the number of leakage nodes detected in the right side of the window.
- To see which nodes are affected please see the Last column – Adjusted Emitter Coefficient in the Adjustment Groups. Sort the column descending by right clicking on it, to see the affected nodes. Here you can see that junctions J-4 & J-14 are detected as leak nodes having adjusted emitter coefficients of 0.07 & 0.04 , rest all junctions are free from leakage.
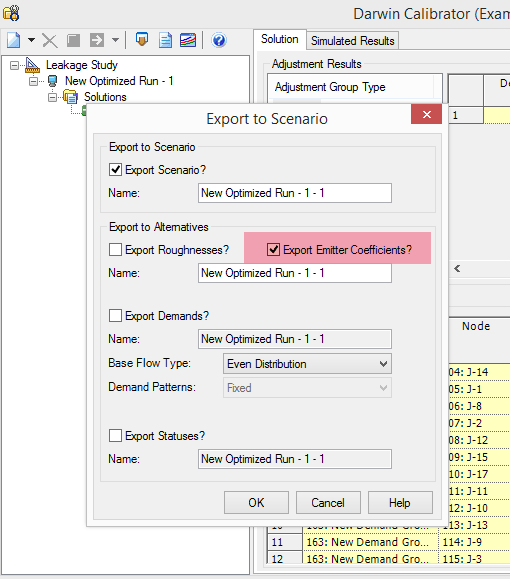
- Now export the results in the form of scenario to visualize in the model. While exporting the results only select Export Emitter coefficients.

Viewing the results using Element Symbology
- Make newly exported scenario as active> Analysis>scenario>Compute the active scenario - New Optimizes Run .
- Go to Element Symbology>Junction>New color coding.
- Select Emitter Coefficient as the field name>color & size the elements.
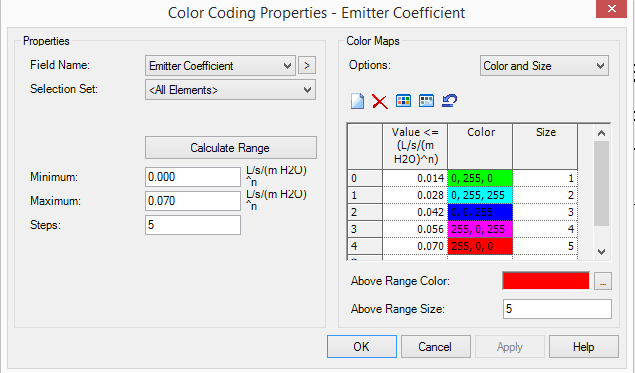
- You can visualize the leakage elements in the model.

See Also
Locate sources of non-revenue water usage with Darwin Calibrator in WaterGEMS
http://www.bentley.com/en-us/Solutions/Water%20and%20Wastewater/Water%20Loss/
http://communities.bentley.com/products/hydraulics___hydrology/w/hydraulics_and_hydrology__wiki/5910.using-darwin-calibrator
http://communities.bentley.com/products/hydraulics___hydrology/w/hydraulics_and_hydrology__wiki/running-a-criticality-analysis
http://communities.bentley.com/products/hydraulics___hydrology/w/hydraulics_and_hydrology__wiki/2671.setting-up-pressure-dependent-demand-tn
Model for leak det technote.zip