| Product(s): |
WaterGEMS, WaterCAD |
| Version(s): |
08.11.06.XX |
Overview
The SELECTseries 6 release of WaterGEMS and WaterCAD includes many new features and improvements. Let's explore each of these in detail.
List of Topics
Updated Platform and Operating System Support
SCADAConnect (WaterGEMS)
Flushing
Controls
FlexTables
Variable Speed Pumps (VSP)
Calculation Performance
Customer Meters
Other
Updated Platform and Operating System Support [Top of Page]
The following platforms and operating systems are now supported:
- AutoCAD 2015, 2016
- ArcGIS 10.3.X (WaterGEMS)
- Windows 10
SCADAConnect Simulator (WaterGEMS) [Top of Page]
This release includes a major upgrade to SCADAConnect Simulator. There has been a complete rewrite of the user interface making it much easier for a non-modeler to create runs for pipe breaks, fire flows, shut downs, unusual demands, or overriding controls.
Note: A SCADAConnect Simulator license is only available with WaterGEMS. Starting with this release, WaterGEMS includes a free unlimited signal license. (meaning, it does not check the license). For WaterCAD, the license will be checked for the number of signals, for cases where you happened to have purchased SCADAConnect signals in the past.
GUI enhancements to the Home tab for improved user experience
We now offer a new easier to use layout, to quickly and easily access:
- Time browser, to scroll through time in your run
- User notifications
- SCADA elements flextable for viewing or modifying your SCADA data quickly
- Graphs tool for creating graphs for visual display of how properties like pressure, hydraulic grade, velocity, and flow occur over time
- Named views for creating scaled views of specific areas of interest in your model (all tools located in the red box below).
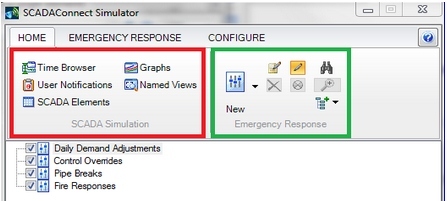
In the green box shown above, you will now find quick ways to:
- Create a new pipe break or fire response by using the 'New' button
- Easy access to the 'edit' (pen and paper icon) button to make changes to your existing input
- Highlight button (pencil icon) to show elements in your model for the selected run, which allows for easy location of study areas
- Find button (binoculars icon), which allows for quick and efficient location of a element by label or ID for a faster response analysis of a pipe break
- Delete button (X icon)
- Isolate break icon (see below) for entering your pipe break information
- Icon to expand or collapse the tree structure for the daily demand adjustments, control overrides, pipe breaks, and fire responses.
In the area at the bottom, elements will be grayed out when they are unchecked or not in use. This can be seen in the screen shot below highlighted by the red boxes. This should allow you to quickly locate areas you're focusing your work on.

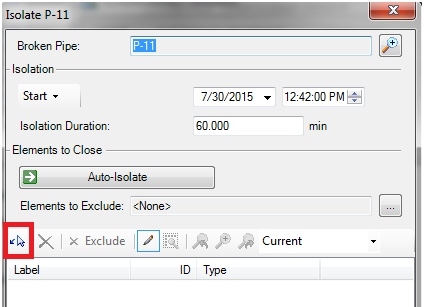
Auto isolate pipe break tool
Clicking the “Auto-Isolate” button will automatically select the closest elements (such as isolation valves that are available to close off this pipe from the system and add them to the bottom portion of the window below. If you wanted you could also choose to select the elements from the drawing using the “Select in Drawing” icon (outlined by the red box) that will be used to isolate the break. We also allow you to exclude certain elements from the elements that you want isolated, highlight all the elements that are included in this run using the pencil like icon, zoom to a selected element in the drawing for easy location, and quickly zoom in or out of the drawing using the drop down menu that allow you to scale your model by current view or a percentage of the current view (25%, 50%, 75%, 100% - 400%). This will allow you to easily identify the area that you’re studying while allow you to examine what happens in other parts of the model while the break scenario is running.
Unlimited SCADA Signals available to WaterGEMS users
WaterGEMS users will now have no limit to the number of SCADA signals that can be used in a model.
Added the ability to see SQL statements being used for operations and customize them for optimal performance
In order to enable customization, click the checkbox for the "Customize SQL Statements", which will make the statement text boxes editable. If you make a mistake or want to reset the statements to the default you can click the "Reset to default" button that his highlighted by the blue box in the screen show below. This new feature will allow you to accommodate any SQL extensions that your database may support, opening potential support for other data historians such as GE Proficy.
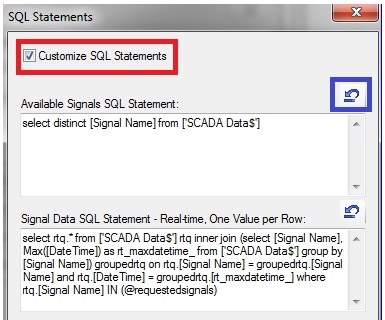
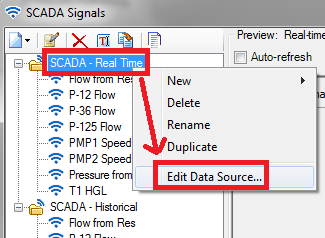
To locate this feature, click the SCADA Signals button on the Configure tab to open the SCADA Signals window, then right click on the folder label and choose "Edit Data Source..."
Added intermediate time steps for control overrides and fire flow demands
While this change cannot be seen visually what it will do is allow time steps to be inserted by SCADAConnect Simulator for hydraulic calculations when a control override is applied or a flow demand is added/removed. This will improve the accuracy of the calculation results.
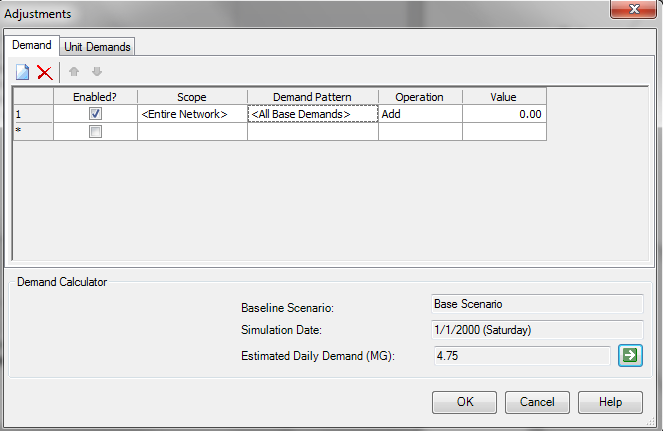
Network Demand Calculator
Right clicking on “Daily Demand Adjustments” in the tree view allows you to edit the demands or unit demands shown in the screen shot below. You select the scope that you want to edit (default is <Entire Network>), choose the demand pattern that you want to use (default is <All Base Demmands>), set the operation (add, divide, multiply, subtract, or set) of the value you define. In the lower right corner of this dialog you can then use the green compute button to estimate the total daily demand given your adjustments.
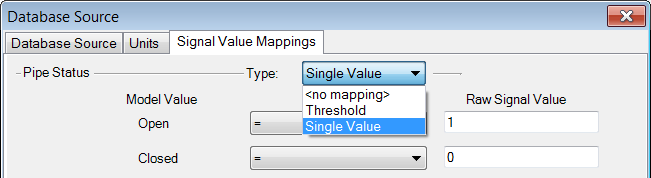
Signal Value Mapping for translating SCADA signal values and formats
The ability to map SCADA signal values to a raw signal value has been added to the Database Source dialog. This takes into consideration that SCADA signal values may have varying formats and provides additional flexibility to transform these values into a form the software can interpret. This new feature can be accessed by going to the Components menu, select SCADA Signals, then click the Edit icon. Available options for the status types are <no mapping>, Threshold, and Single Value. The Threshold type allows the use of operators =,!=, <, <=, >, >=, and <none>. When the Single Value type is selected, only = and <none> are available.
Several improvements have been made to Flushing Workflow
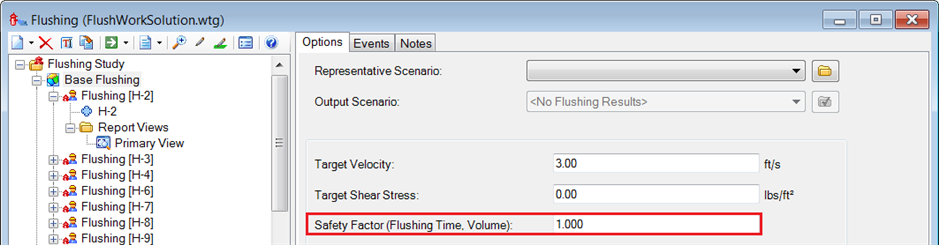
Safety Factor
The "Safety Factor" field has been added to the flushing area options screen to identify recommended flushing time/volume. In the Flushing Results Browser, the "Recommended Flushing Volume", and "Recommended Flushing Time” fields are computed by multiplying the "Safety Factor" by the related "minimum" value.
Better User Notifications
When computing a flushing area with no pipe set defined, the following User Notification will appear.
"The pipe set for this area must contain at least one pipe. Refer to the "Pipe Set" field on the flushing area [Options] tab."
When computing a flushing event with the area Flowing Emitter Coefficient and Flowing Demand set to 0 the following User Notification will appear.
"You should provide a non-zero flushing flow value. Refer to the "Flushing Flows" field on the flushing area [Options] tab."
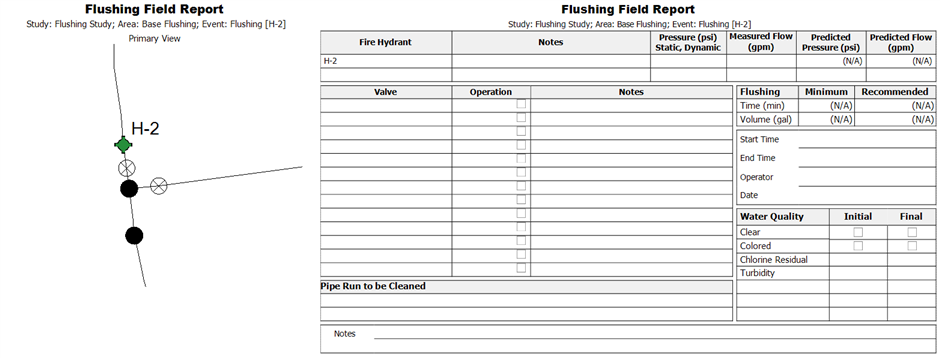
Improvements in Flushing Report
Reduced to 2 pages instead of three
The flushing report has been reduced from three to two pages per hydrant.
Include Reopen, Reclose, Close (Prior), and Open (Prior) result options, based on the status of a valve in a previous event
The flushing report's event elements table and operator's field report now provides context on valve/pipe status based on the prior event so the valve that was closed in the prior event, that should remain closed in the current event, doesn't have to be reoperated and so the valves can return to the correct state when completing an event. Some of these rows in the Event Elements table are virtual and can't be deleted. These rows indicate steps that need to be performed to restore valves to their original state after the prior event. If valve is not to be reopened/reclosed, select in drawing to change.

Improved Results Highlighting


Quick Pipe Run Creation Tools
Prior to WaterGEMS and WaterCAD V8i SELECTseries 6, the unidirectional flushing event element selection only allowed you to select one pipe at a time to add pipes to the flushing event pipe list. The Add Pipe Run Elements tool now has the ability to pick a node and add pipes in the shortest path between the selected node and the nearest end nodes of pipes already selected.
An Undo button has also been added to let the user undo the last element selection. Undo works for all types of element selections, including adding pipes in a path, adding single pipe, adding operational open element, adding operational close element and removing an element.
The Highlight Previous button will highlight the previous event's elements.

Auto Isolate feature
The Auto-isolate button in the pipe run creation toolbar (see above) allows you to quickly identify candidate isolation valves to close off the selected pipe run, which will save you time when compared to manually picking valves to close with the third button. Be sure that no demand nodes are isolated using this tool.
Option to Select Boundary Valves for Flushing Run
You can now select valves to close during a flushing area: Pipes, isolation valves and valve nodes. These elements will be closed during all events in the respective flushing area. This can be useful if you have valves that will close off a larger section of the model during multiple flushing events in that area.

Improvements to Controls [Top of Page]
Easier creation and management of controls, conditions and actions
Controls can now be accessed and created easier from the newly added icons and managers. These performance enhancements will make creating controls faster and remove the need to hunt for the condition or action you’re looking to add. This is done through the use of the new interactive select tools that are located in the following locations in the control manager.
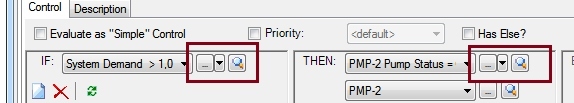
From clicking on the drop down arrow (the middle icon) you’ll see a menu of 3 items (see screen shot below).
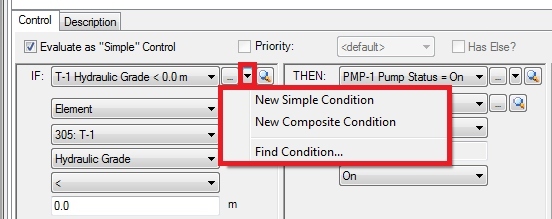
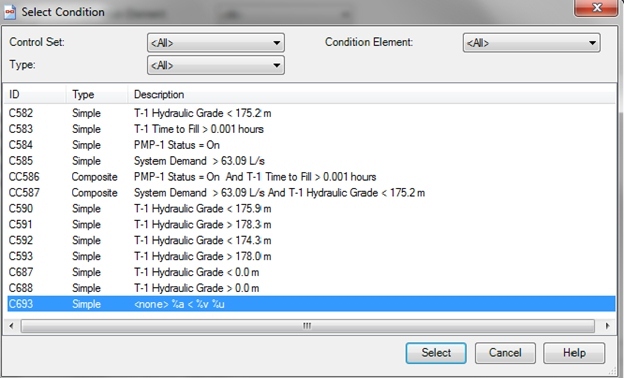
The last item in the menu, the ”Find Condition…” function, is most useful when try to locate a previous condition or action you already created. When the option is selected it opens the manager found in the screen shot below. From here you simply choose a condition (there is a similar dialog for actions) and click the ‘’Select” button to choose it. The condition is then populated for the control you’re creating. This is great improvement from previous versions where you would have to choose the condition or action from a drop down menu.
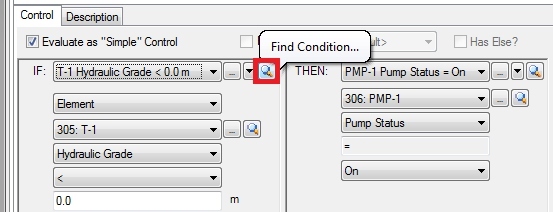
The find function can also be accessed quicker by clicking on the magnifying glass icon as show in the screen shot below.
Easier creation and management of control sets
There is also newly added functionality for making control sets easier to create and manage. The choices for this are located on the icon drop down menu shown below on the controls manager window.
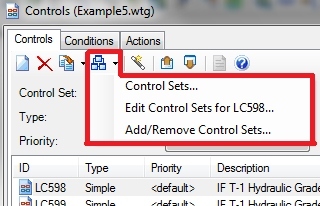
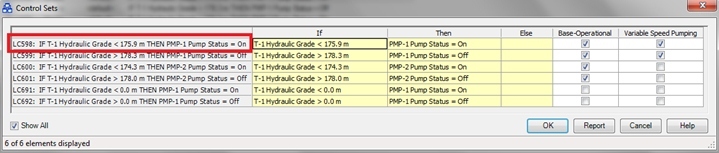
Clicking on the “Controls Sets…”option will open the control sets manager window seen below. The “Edit Control Sets…” option opens the same window. The difference between the two is that you can select multiple controls in the controls window (show in the screen shot above) by holding down the Ctrl button or using the Shift button. Then you can use the “Edit Control Sets…” option to open just that selection set of control sets to work with. Choosing the “Control Sets…” option always opens all the controls in the “Control Sets” manager window. In this window (shown below) you’ll also notice the names of the selection sets with a list of check boxes. These columns allow you to quickly associate or remove a control from a particular control set.
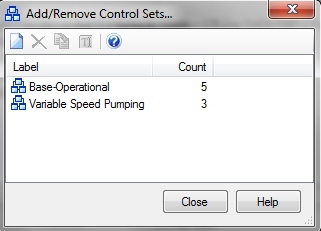
The last option “Add/Remove Control Sets…” will open the window shown below where you can add or delete control sets. The count field lets the user know how many controls are included in a given control set. You need to create a control set in this window before you can begin associating controls to it as shown in the “Control Sets” window above.
Controls Import and Export
An addition that will save time when creating new models are the import and export buttons at the top of the Controls manager window. When you use the export button you create a .ctl file can then be imported to another model, sent to a colleague, posted on the internet, or shipped to a client. This will help because you won’t have to create your controls, conditions, and actions over and over for each model. Note that this feature would mainly be useful in cases where you need to create a new copy of a model, with the same elements.

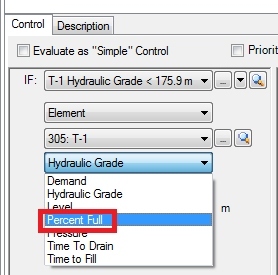
Percent Full condition for tanks
The tanks element received a new “Percent Full” condition option that will allow you to specify a given action to occur when your tank gets to a certain percent level full.
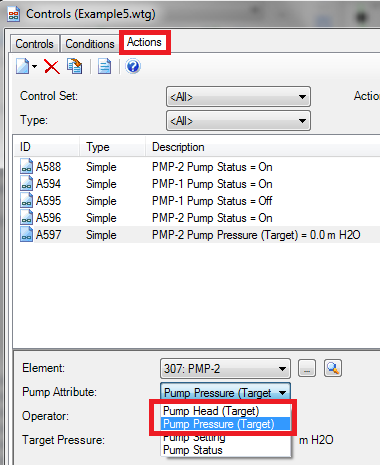
There are also newly added actions for the pump element that will allow you to create a control to have a pump achieve a target pressure and pump target head, which will be useful for VSP pumps. For more on this, see further below under the VSP section.
Several usability improvements have been added to Flextables:
Freeze, Select, Add, Remove Columns
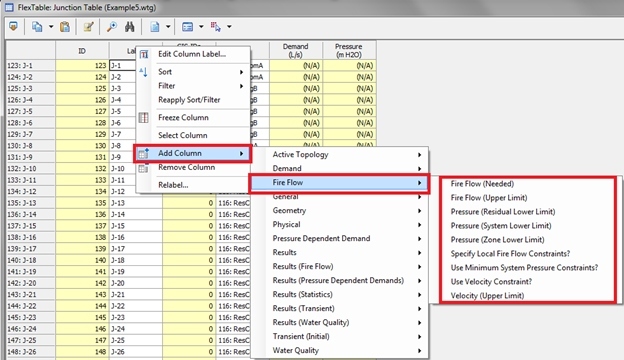
The flextables have some very useful new features added. By right clicking on the grey column headers you will see the Freeze Column, Select Column, Add Column, and Remove Column options.

Freeze Column – Will freeze that column and all columns to the left of it, so when you have a lot of columns in your flextable and need to scroll to the right you can freeze columns. For example, this is come be useful to keep a column like the label constantly visible for identification purposes as you access other columns.
Select Column – Allows you to easily select all the records in that column, which is useful if you want to copy the data from that row to spreadsheet.
Add Column and Remove Column – In previous versions in order to add or remove a columns, you’d need to click the edit button at the top of the flextable, but now you can easily select a property to add to your flextable through the add column option. When you move your mouse cursor over the add option a popup menu appears that breaks all the columns down by their category (general, physical, results, geometry, etc…). This makes finding properties much simpler than choosing from the entire alphabetized listed using the edit button in previous version. If you still prefer the using the edit button to add and remove your columns you will still have that option.
Element selection by highlighting rows
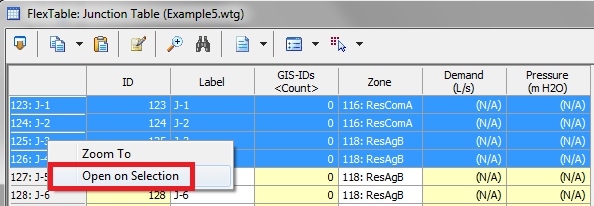
Another feature that adds great flexibility is the ability to select rows in the flextable by clicking on them. Rows are selected the same way you select them in an Excel spreadsheet. Once selected you can right click on the row header and choose “Open on Selection”. This will filter your flextable by the rows you’ve choose.
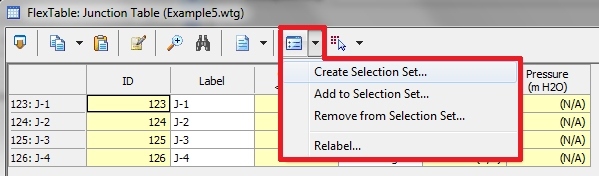
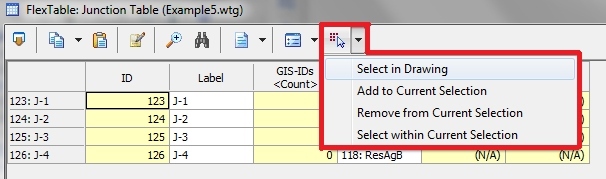
This will allow you to perform tasks such as creating a selection set or adding to a selection set with more ease. It will also allow you to select the elements in the drawing that you have selected in the flextables. In previous versions both of these tasks would have to be done in the drawing pane or by using queries.
The screen shots below show the process of filtering a flextable on row selection and show the menus for making selection sets and selecting elements in the drawing.

While the flextable is filtered you now also have the option to right click and global edit on a column for only the features in that selection set.
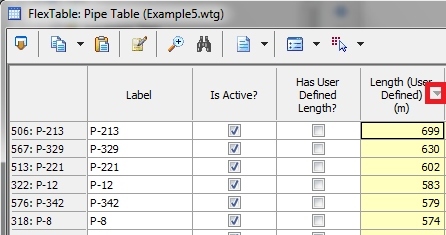
Sort arrow
In the screen shot below you’ll see a small arrow has been added to columns that are sorted to indicated whether the sort is in ascending or descending order.
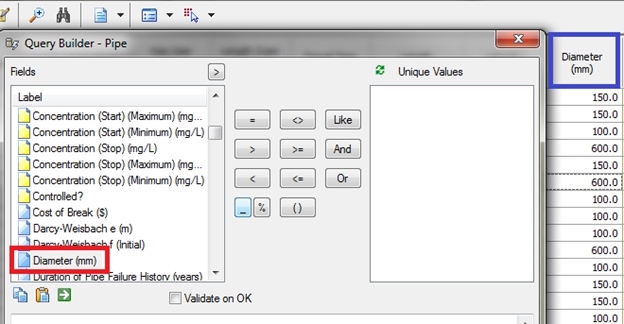
Faster filter work workflow with auto selection
When your right click on a column and choose to filter it using a query that column will now automatically be selected in the query builder to allow for faster queries to be created. In the screen shot below if you clicked on the diameter field outlined in blue and choose to filter by a query the diameter field in red would be automatically selected when the query builder opened.
Find text in the FlexTable for faster feature location and selection
Click the binoculars icon
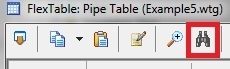
It will open this dialog that allow you to enter text to search the flextable based on

Variable Speed Pumps (VSPs) [Top of Page]
VSP handling and user notifications are now more robust and provide for easier troubleshooting.
Overall improvements to VSP calculations
Several improvements have been made in the pressure solver to provide for more stable VSP calculations. This allows you to run more complex models and VSP arrangements with easier troubleshooting.
Improved headloss calculations for parallel VSPs
For parallel VSPs with relatively small diameter pipes the headloss is more accurate in the suction and discharge pipes. The flow is now calculated inversely proportional to the number of pumps running at a particular time step.
New user notifications
a) If the suction or discharge pipes of fixed head parallel VSPs differ in diameter, length, roughness or minor loss coefficient, a user notification will be generated when validating or when calculating the model which says something similar to, "At least one discharge or suction pipe in a parallel VSP group has different pipe attributes (length, diameter, roughness or minor losses)." Headlosses for all pump pipework are based on the physical characteristics of the lead pump pipework. This is because of the parallel fixed head VSPs rules that dictates they need to use the same pump curve, control node, target head (pressure), etc...
This user notification won’t be shown for parallel fixed flow VSPs because the flows for these can be different and therefore are calculated independently of each other using the unique upstream and downstream pipe attributes
b) A user notification warning was added that says, "Pump cannot deliver the target head" if a VSP (or VSPB) can't reach the target HGL.
Improved handling for parallel VSP functionality when a lead/lag pump is closed
a) If one of the suction/discharge pipes of a parallel fixed head VSP lag pumps in the group is initially closed or closed by a control the other corresponding lag pumps will be turned on.
b) The order of the lead pump loading has been changed for when the first loaded pump is initially off. In this case, the first initially opened parallel VSP is used as lead pump and the first loaded pump that was the lead pump is changed to a lag pump.
d) Enhanced estimation of the flow used to calculate the pump speed factor for a single VSP pump with multiple upstream pipes.
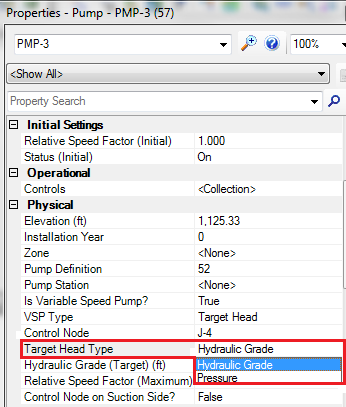
New Target Head Type pump attribute
Added “Target Head Type” as a property with the attributes of 'Hydraulic Grade' or 'Pressure' to choose as the target to meet for target head (fixed head) VSP type.
Ability to use a fixed head and fixed flow VSP in the same scenario
The calculation engine was made more robust to support the use of a fixed head and fix flow VSP's in the same scenario. Up to this version the combination of these two types of pumps was not possible.
New pump control actions
Pump pressure and HGL target has been added as a control action type. This allows you to easily change the target during the simulation.
Calculation Performance [Top of Page]
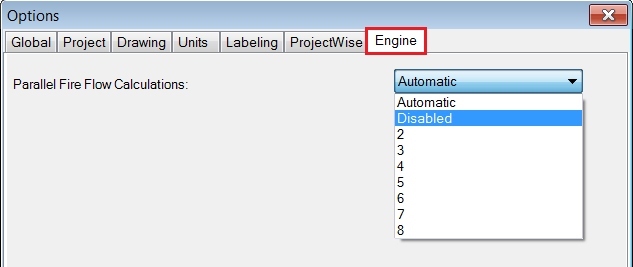
Multi-threading Fire Flow Calculation
Have complete confidence in the improved speed, stability and robustness of the newly implemented multi-threaded fire flow calculation. The amount of parallel fire flow calculations can now be selected by going to Tools > Options > Engine tab. This improvement takes advantage of multiple CPU cores.
Parallel Linear Solver for Faster Calculation
Improvements have been made to the hydraulic solver to reduce processing time.
Darwin Scheduler Performance Improvement (WaterGEMS)
For WaterGEMS users, Darwin Scheduler's performance has been improved. It now runs faster to provide better solutions for larger problems to optimize fixed speed single pump operation.
Affected Customer Meters Listed in Criticality Results
When computing a Criticality study, the affected customer meter nodes are listed. This allows a selection set to be created from the affected customer meters to quickly notify the users if needed.
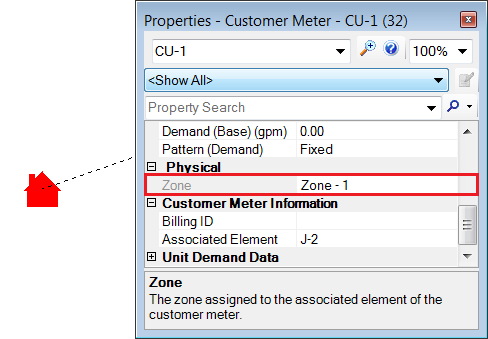
Customer Meters Have Zone Property
Customer Meter elements now have the Zone property. This is useful for DMA's (District Metered Areas) and water audits, and with the Pressure Zone Manager (see below).
Customer Meters Added To Pressure Zone Manager
The Zone Results in the Pressure Zone Manager now includes customer meters to show what zone they are in.

Bentley Communities Search
A "Search" button has been added to dialogs.
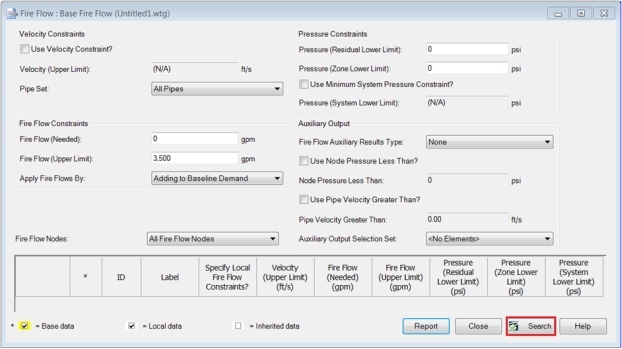
Once clicked, a new tab will open in your internet browser and search the Bentley Communities wiki database using the name of the tool or manager it was clicked from. Click here to go to a support solution that explains how to search for content.

RSS Feeds in Standalone
Once you have been on the Be Communities website and created an account, you can sign up for RSS Feeds. On the Be Communities website, log in, then scroll down to the bottom and you will see, under Social Media, RSS Feed.

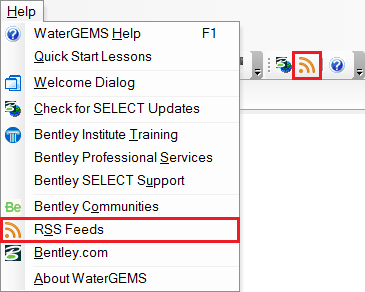
The RSS Feeds dialog can now be opened from the help toolbar and from the help menu.
Once you have signed up for the RSS Feed and chosen the subjects for your feed, when in WaterGEMS or WaterCAD, you can go to Help > RSS Feeds to see a list of the wikis and/or forums on your feed.
Note: You must have a project open in order to do this.
After you select RSS Feed a box will open with your feeds. You can do a search by typing a search term in the search bar, or you can do a filter by clicking on the filter button. If you click on the settings button in the upper right corner, a dialog box will pop up. Here you can select a product's feed.

Pipe Renewal Planner Capacity Score Type (WaterGEMS)
For WaterGEMS users, the Pipe Renewal Planner capacity score can now be calculated based on either the headloss gradient or velocity. Prior to this release only velocity was used.

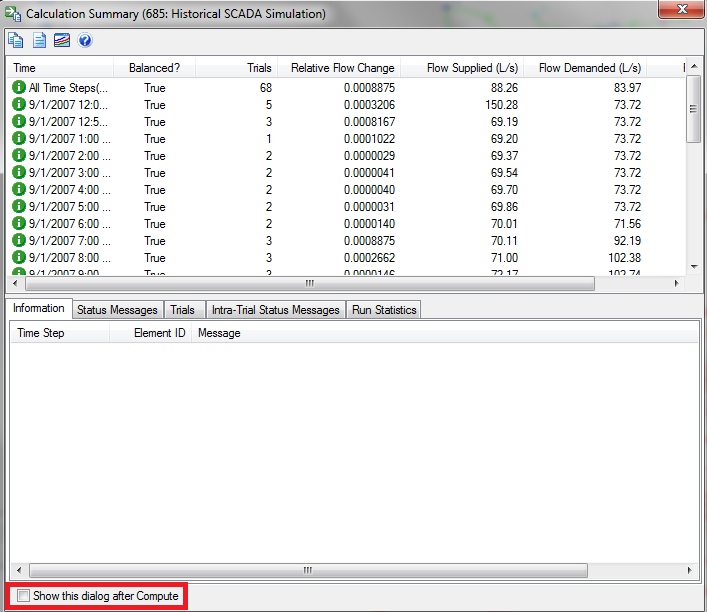
Auto-Open Calculation Summary
The calculation summary will open after every run if the check box is checked and will not open if left unchecked. This will enable a more customized user experience.
Export to Excel
Previously, data could be exported to Excel via the Flextables, but needed to be done one by one and did not include time series. Now, there is an ability to export data for all element types at once, including time series (results over time).
Steps:
- Go to, File > Export > Export to Excel.
- Then, in the Export to Excel dialog, specify properties and elements to be exported. Click OK. Note: these settings will be saved for the next export.
- In the FlexTable Export dialog, select either Excel or CSV format and specify where it will be exported. Click OK

Junctions and Hydrants Node Layer in Loadbuilder
You can now select "Junctions and Hydrants" as a node layer in Loadbuilder using the nearest pipe and nearest node methods. This is useful in cases where you need to assign loads to both hydrants and junctions, not one or the other.
See Also
Product TechNotes and FAQs
OpenFlows Methods Product Tech Notes And FAQs
Hydraulics and Hydrology Forum
External Links
Bentley SELECTservices
Bentley LEARN Server