| Product(s): |
WaterGEMS,WaterCAD |
| Version(s): |
V8i, CONNECT Edition |
| Area: |
Output and Reporting |
Problem
Is it possible to compare or visualize results between scenarios for example with annotations?
Solution
As of version 10.04.00.108, a dedicated tool for comparing results between scenarios is not available (ref: Enhancement 1034666). Annotations will reflect the current (active) scenario. One of the following approaches can be considered.
Note: not to be confused with Scenario Comparison, which helps you find differences in input data between scenarios.
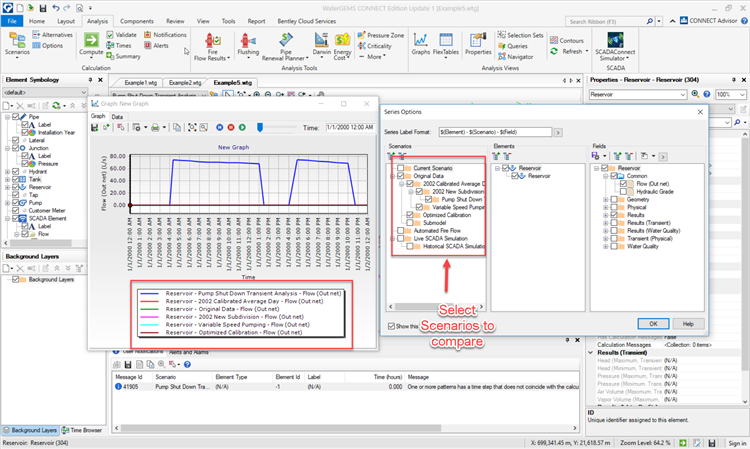
Graphs, Data tables and Profiles
Graph or profile the desired elements together and select the desired scenarios in the Graph Series Options. You can also click the Data tab to see the results in tabular form, which can be copy/pasted to Excel if needed.
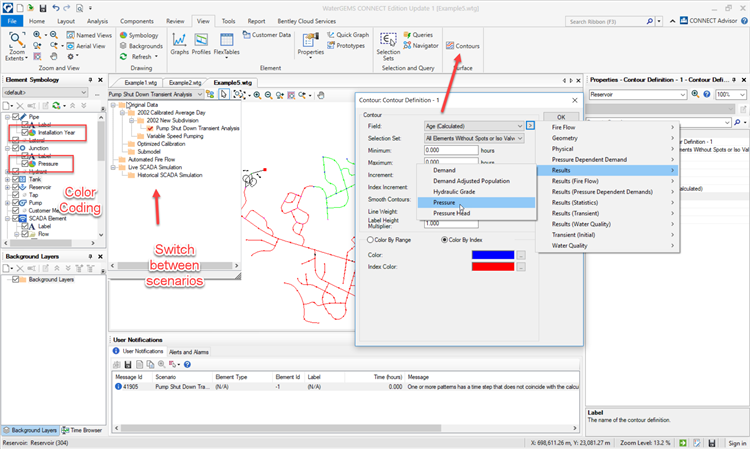
Color Coding or Contours
Set up color coding or contours for the desired result field, then switch back and forth between the scenarios.
Modelbuilder Connection to a Spreadsheet
Set up a Modelbuilder run for each scenario, connecting to a spreadsheet (or different worksheets of the same spreadsheet), which you can then set up (for example in Excel) to show the differences.
User Data Extensions
If for example you want to visualize the differences between results in two different scenarios, you could create a User Data Extension to store the value for one scenario, then use the Flextables to copy and paste the values from one scenario into that user data extension, switch to the other scenario, then create a formula-derived user data extension to find the difference. You can then annotate or color code on the user data extension field to visualize the differences in results between those scenarios. To update the comparison to two different scenarios, you would need to re-copy/paste the values from one of the new scenarios and switch to the second scenario.
See Also
Reporting for multiple elements at the same time
Scenario Comparison