| |
Product(s): |
WaterGEMS, WaterCAD |
|
| |
Version(s): |
CONNECT Edition, V8i |
|
| |
Area: |
Modeling |
|
Problem
Is it possible to run a multi-point trace analysis, where more than one source can be selected? Or, is it possible to track concentration of multiple constituents in a single run?
Solution
This can be done with the Water Quality Batch Run tool, available starting with WaterCAD and WaterGEMS V8i SELECTseries 3 (08.11.03.17).
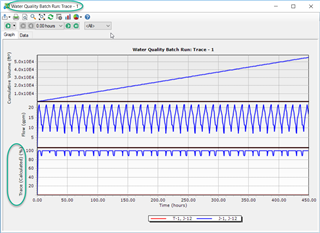
You can view results such as graphs, for the concentration of each constituent, volume of water from each trace source, etc. You can also view tabular reports of results and export for color coding.
Note: this tool does not calculate trace and constituent at the same time - they are two separate runs.

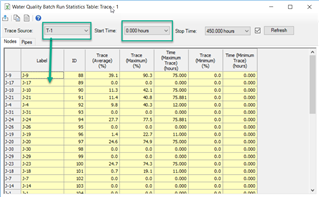
The above tabular results are for trace analysis which shows trace results at each time step for all elements in the model. In trace analysis you can choose between multiple sources of trace and then check the trace percentage for all elements in statistics table by changing trace source.
CONSTITUENT
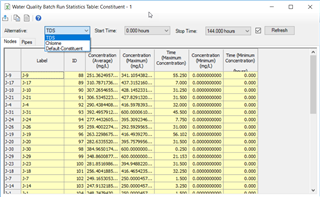
To perform batch run of constituents along with trace, you can select multiple constituents from alternatives as shown below and then see the concentration of each for selected elements. For this first you need to setup respective alternatives for the constituents and select those alternatives and respective scenario in water quality batch run window.
To view the graphs you need to select elements from drawing for which you want to see results in graphical format and in statistics format, results for elements are shown.

See additional resource below and in the Help.
Note that if you want to model the interaction between multiple constituents, you will need to use the Multi-Species Extension (MSX)
Note also if you are using version 10.00.00.55 and the results of a water quality batch run for trace do not match the results of a regular trace run, this is a known issue in that version (reference # 793707). To resolve this, either contact technical support for the latest cumulative patch set for 10.00.00.55, or upgrade to a newer version.
Reporting
Aside from the graphing and statistical table above, starting with the CONNECT Edition Update 2 release of WaterGEMS and WaterCAD, you can now export the maximum, minimum, and average results for a trace or constituent analysis to an Excel spreadsheet or to user data extensions for use with color coding:
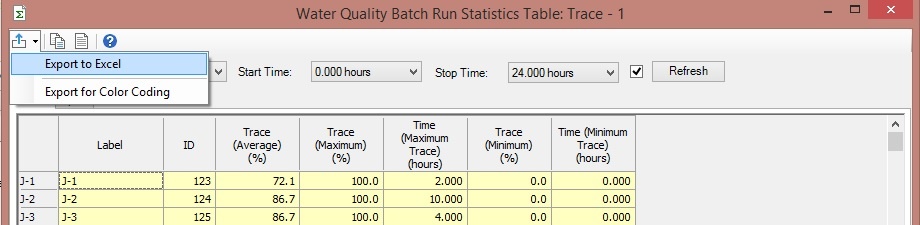
Export to Excel: In the Statistics table, click the Export button in the upper left and choose Export to Excel. The data for different source types will be exported to individual worksheets in an Excel file. For instance, if you have three different Trace sources in your Water Quality Batch Run, you will see three worksheets in the Excel file, one for each source. Each worksheet will display the nodes in the model, as well as the maximum, minimum, and average results for the study.
Export for Color Coding: In the Statistics Table export button, the "export for color coding" will create user data extensions (fields in the element properties) with statistical results for the values for the selected source. For example minimum, maximum and/or average. With this, you can perform color coding on the min/max/average field.
Age, Trace and/or Constituent in a single scenario
If you want to take a single scenario and compute age, trace and constituent at the same time and see all three results in the same scenario, select "Age, Constituent and Trace" as the Calculation Type in the calculation options. This is a new option introduced with CONNECT Edition Update 3, and in a patch for version 10.02.01.06 (contact Technical Support).
For older versions, a workaround is to duplicate your calculation options, change the analysis type (age/trace/constituent), then create three separate scenarios and only change the calculation option, then use the batch run feature in the Scenario manager to compute all three scenarios in batch. If you wanted for example to see the age, trace and constituent in the same graph of an element, you could choose all three of the scenarios, then choose the calculate age, trace and constituent and they will show in the same graph.
See Also
Track multiple sources or constituents with Water Quality Batch Run (video)
Using Multi-Species Extension (MSX) for advanced water quality modeling