| Applies To |
WaterGEMS |
| Version(s): |
08.11.06.113 and higher |
| Area: |
Modeling |
This TechNote provides details on using the new SCADAConnect Simulator found in WaterGEMS CONNECT Edition and V8i SELECTseries 6. Some of the information may overlap with information found in the existing TechNote for SCADAConnect Simulator for WaterGEMS V8i SELECTseries 5.
The SELECTseries 6 release of WaterGEMS introduced a major upgrade to SCADAConnect Simulator (which you also see in the newer, CONNECT Edition). There has been a complete rewrite of the user interface making it much easier for a non-modeler to create runs for pipe breaks, fire flows, shut downs, unusual demands, or overriding controls. The CONNECT Edition release of WaterGEMS includes additional available features, such as power outages, pipe shutdowns, and the ability to import control overrides.
Note: A SCADAConnect Simulator license is now only available with WaterGEMS. Starting with the V8i SELECTseries 6 release of WaterGEMS, a free unlimited signal license is included. Meaning, it no longer performs a license check. Starting with CONNECT Edition Update 2 (10.02.00.43 and greater), SCADAConnect Simulator is also no longer available/visible inside WaterCAD (in previous versions the tool was still visible but a license check on the number of signals was performed.) If you have WaterCAD and need to use SCADAConnect, you will need to upgrade to WaterGEMS. See: WaterGEMS vs. WaterCAD
This TechNote also includes a general workflow for using SCADAConnect Simulator. SCADAConnect Simulator provides a way for users to modify and run a model scenario from a very simple user interface without the need to interact with some of the more sophisticated features of WaterGEMS. It will allow you to quickly adjust daily demands and controls and to simulate a pipe break or fire response. It will also allow you to easily scroll through time using the Time Browser, graph elements of interest, view user notifications, create views of specific areas for quick viewing access, and create customized element alerts. These tools can be used for running model input data, historical SCADA data, or live SCADA data.
User Interface in WaterGEMS
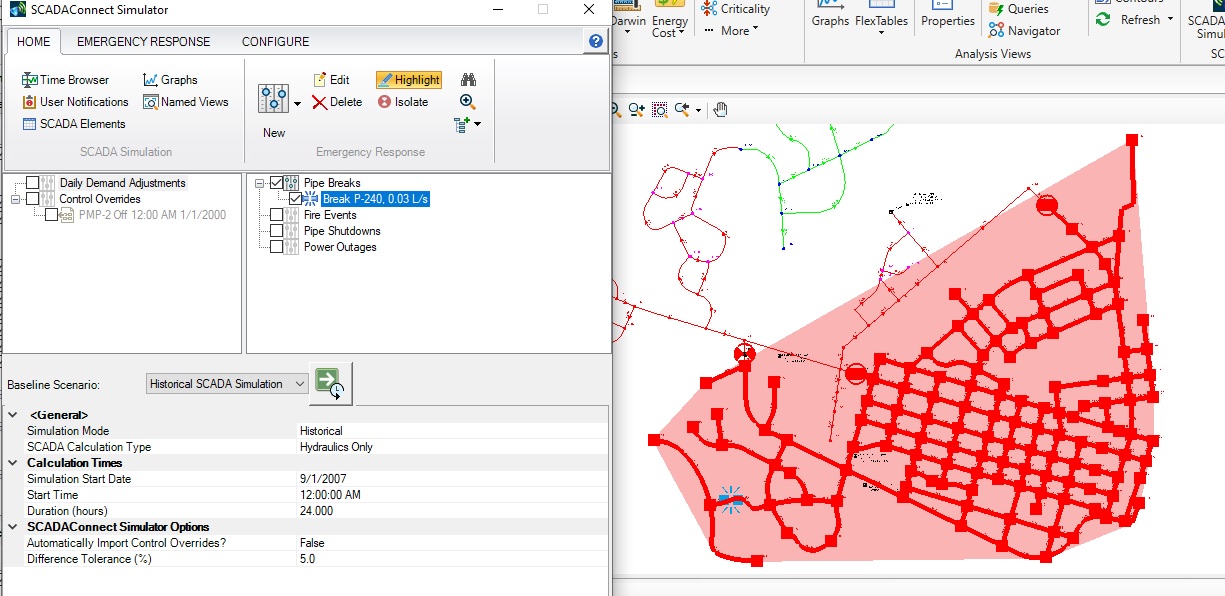
The user interface in WaterGEMS has an easy to use layout. A screenshot of SCADAConnect Simulator from CONNECT Edition can be found below:

There may be slight differences in earlier release, but the workflow will be the same. In the Home tab, the upper part of the dialog is split into the SCADA Simulation section and an Emergency Response section.
The SCADA Simulation section includes access to the following features:
- Time browser, to scroll through time in your run
- User notifications
- SCADA elements FlexTable for viewing or modifying your SCADA data
- Graphs tool for creating graphs for visual display of how properties like pressure, hydraulic grade, velocity, and flow occur over time
- Named views for creating scaled views of specific areas of interest in your model
The Emergency Response section includes access to the following features:
- Create a new pipe break or fire response by using the 'New' button
- Easy access to the 'Edit' button to make changes to your existing input
- Highlight button to show elements in your model for the selected run, which allows for easy location of study areas
- Find button, which allows for quick and efficient location of an element by label or ID for a faster response analysis of a pipe break
- Delete button
- Isolate break icon for entering your pipe break information
- Icon to expand or collapse the tree structure for the daily demand adjustments, control overrides, pipe breaks, and fire responses.
Some of these features will be explained in greater detail below.
In the Emergency Response tab in the ribbon allows the user access to the Pipe Break, Fire Response, Pipe Shutdown, and Power Outage features. These will be explained in detail below. Pipe Shutdown and Power Outage are not available in WaterGEMS V8i SELECTseries 6.
The Configure tab allows the user access the SCADA Signals, which is where you import the SCADA data for use in WaterGEMS, and connect to model elements. Import Initial Settings and Results Publishing is also available from this tab. The features in the Configure tab, as well as some of the information in SCADA Simulation section of the Home tab were previously available in SCADAConnect Simulator for WaterGEMS V8i SELECTseries 5.
The middle section of the main SCADAConnect Simulator dialog gives the user quick access to features available in SCADAConnect. In addition to the features found in the Emergency Response tab, it also includes Daily Demand Adjustments and Control Overrides.
The bottom section of the dialog allows the user to select between Historical or Live simulations, define the run time, and compute the simulation. Computing the simulation will come after all SCADA data is imported and the necessary SCADA elements are included in the model.
Setup
SCADA Element
In order to run SCADAConnect Simulator, it is necessary to have a model with an existing Extended Period Simulation (EPS) scenario. When using a baseline scenario as a starting point for some SCADAConnect Simulator runs, the user may not want to modify an existing scenario on which the later SCADAConnect runs are based. This is because SCADAConnect Simulator runs can modify the calculation options (such as start time, demand adjustments, or control overrides) or initial settings (such as tank level or pump status). Because of this, it is advisable to create a child scenario of the original scenario and make that the new baseline scenario. This new child scenario should have a different calculation option and a different initial settings alternative. The screenshot below shows a sample of what this might look like.
Note: As of WaterGEMS CONNECT Edition Update 2 (build 10.02.01.06), SCADA signals can be added for reservoir elevations.
Note: New SCADA properties were added in CONNECT Edition Update 3 (build 10.03.00.69). These include Tank Status (whether it is filling or emptying) and Difference and Difference (Relative). The Difference fields define the numerical and relative difference between the SCADA data and the calculated results.
Note: As of WaterGEMS 2023 (version 23.00.0016), PRV pressure, hydraulic grade, and flow results can be used with the SCADA element.
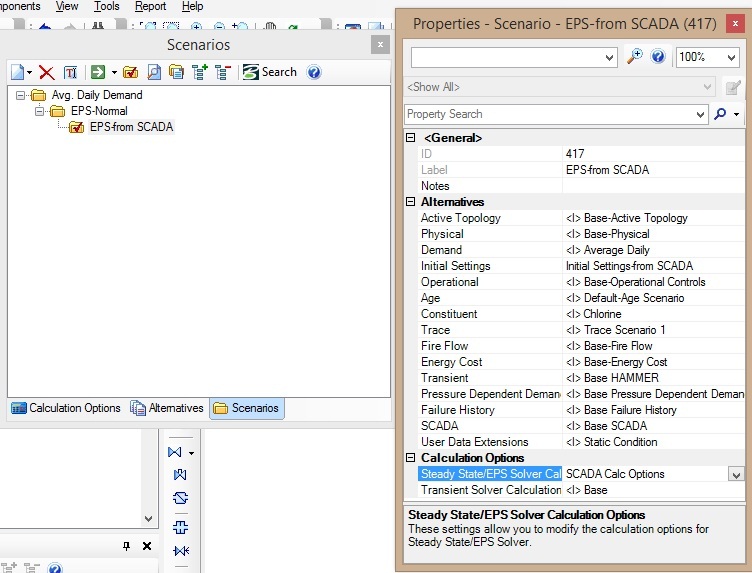
In the screenshot, the starting scenario is "EPS-Normal,” with an initial conditions alternative called “Base-Initial Settings” and a calculation option call “EPS24.” A child scenario was created called “EPS-from SCADA.” This new scenario uses a new child alternative called “Initial Settings-from SCADA” and a new calculation option called “SCADA Calculation Options.” Setting up the SCADA Simulator this way would enable the user to try a wide variety of adjustments without changing the settings for the starting scenario. This setup of a new scenario and alternative is not necessary, though a new calculation option would be generally be used.
Once you have a working model, review the SCADA data that you have. You will need to add SCADA elements that will represent the data you will be reviewing. For instance, if you have SCADA data for pump flow and pump status, you will include a SCADA element for each of these, connected to the pump model elements. Generally, the SCADA element will be added manually since there are likely a manageable number of them for a given model. Select the SCADA element from the Layout toolbar and place it near the element it is associated with. Pumps and tanks are common elements that SCADA elements will be associated with, but they can also be associated with pipes and valves. It is important to have a good understanding of your data so you know where to add SCADA elements. More on SCADA Signals here.
The screenshot below shows SCADA elements associated with two pumps and a pipe in a sample mode, Example5.wtg. This example file can be found at C:\Program Files (x86)\Bentley\WaterGEMS\Samples\Example5.wtg.
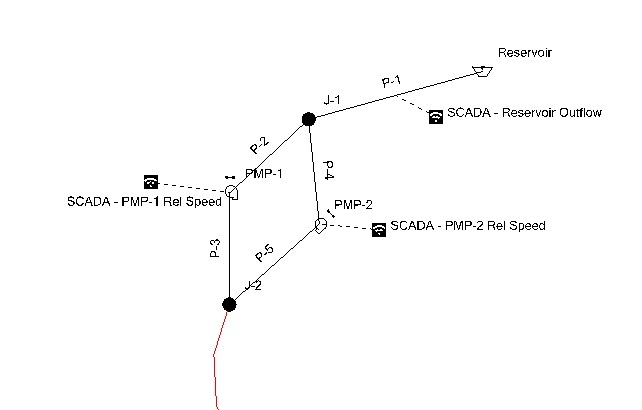
The SCADA data associated with this example is an Excel worksheet. That worksheet contains data for pipe flow in P-1 and relative speed factor data for the pumps. With that data available, SCADA elements were included for these three elements. (Note: there are also SCADA elements in this sample model associated with a tank, as well as a few other pipes in the system. The focus is on these elements for clarity.)
Once the SCADA Elements are added, you will need to associate them with an model element. To do this, double-click the SCADA element to view the properties. Find the attribute Model Element and select “Select Model Element.” This will open a Select toolbar to allow you to choose and element in the drawing pane. When you select the element, it will be connected with a dashed line, as shown in the screenshot above.
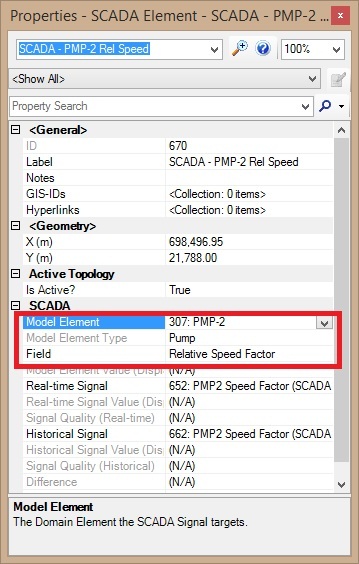
You will also need to assign the Field attribute. This denotes what element property field the SCADA Element represents. For a pump, this could be Flow or Relative Speed Factor. For a tank, this could be Level or Tank Status. For a pipe, this would be Status or Flow. You can set the Field attribute for the SCADA Element either in the properties grid or by opening the SCADA FlexTable and setting the Field attribute there. The SCADA Element FlexTable can be accessed in SCADAConnect Simulator from the Home tab and choosing SCADA Elements. It can also be reach from the main user interface through View > FlexTables. Below is the property grid for a SCADA element associated with a pump, and representing the pump’s relative speed factor.
The next step would be to link the SCADA data to the SCADA Elements in the model. You can do this in SCADAConnect Simulator by going to the Configure tab and select the SCADA Signals button. From the main user interface, you can open this by going to Components > SCADA Signals. Either option will open the dialog shown below.

On the left side of the dialog, you will see the SCADA connections available for the model. To create a new connection, click the New button. You will see the available sources that are available in SCADAConnect: Database Source (which include a wide array or source and include Excel or Access files), OPC Historical Source, OPC Real-Time Source, and Citect Source.
Data Sources
Database Source
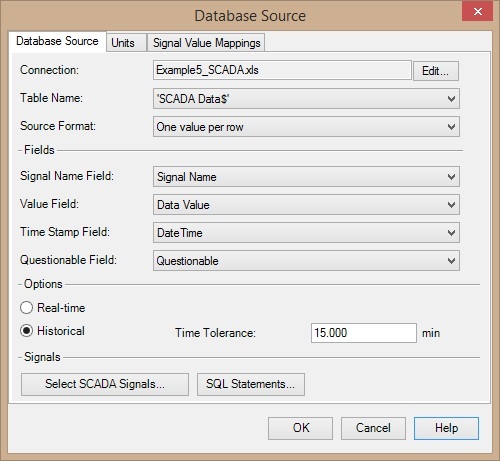
For Database Source connections, select New > Database Source. This will open Database Source dialog. Note: If you have a 64-bit machine with 32-bit Office, make sure that you are working in the 32-bit version of WaterGEMS if you are using Excel or Access files. You can find the 32-bit version of WaterGEMS here: C:\Program Files (x86)\Bentley\WaterGEMS\WaterGEMS.exe.

Click on the "Edit..." button beside the Connection pulldown menu. This will open a Database Connection dialog, as shown below:
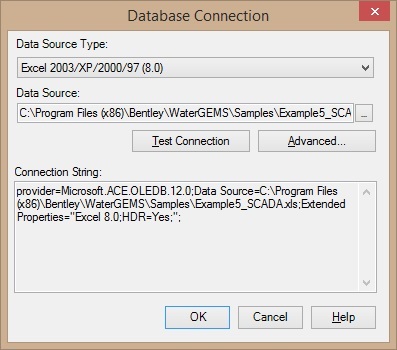
For Data Source Type, choose the appropriate data source, such as Excel. Next to Data Source, click the ellipsis ("...") button and select data source file. Next, click on the Test Connection button and make sure to see the "Connection succeeded" message. Then, click OK to close the Database Connection window. This will return you do the Database Source dialog.
Then continue to fill in the data. What is entered will depend on the data source and the available data. The data from Example5.wtg can offer some guidance, since this uses an Excel file for the data. Table Name is the data table that contains the SCADA data. Source Format can vary depending on the source. For many database sources, there is one value per row, so that option would often be selected. Signal Name Field is the column in the data source that contains the 'Tag' or 'Signal' name. Value Field is the column that contains the SCADA value. Time Stamp Field contains the FULL date and time. Questionable Field is not supported by all SCADA systems. You can leave this as the default if you are unsure. Lastly, you would choose whether the data is real-time or historical. Database source are typically historical sources. Next, choose the Select SCADA Signals button. You will see the dialog below:
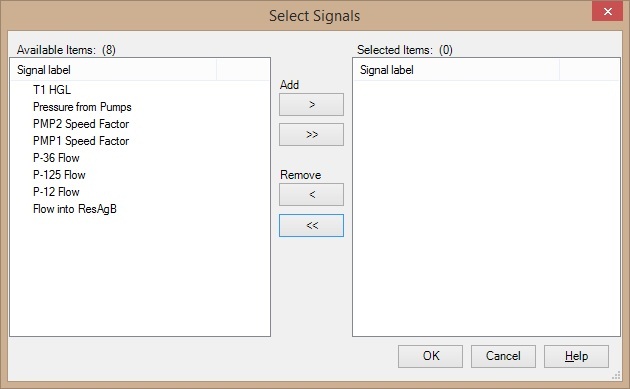
The available SCADA elements will be listed on the left side. Add the necessary signals by, double-clicking the label or clicking ">" or ">>" button. The ">>" will add all. Click OK button when finished. The Database Source will now be filled in.
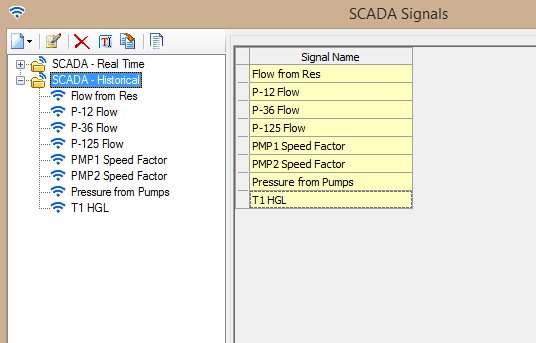
SCADA Signals window will now list the signals in the left panel as a tree structure. Clicking on the signal on the left will show the corresponding data. Make sure to click either on Refresh or Auto Refresh to see the data. The screenshot below shows the data from the Excel source file for the SCADA element associated with pipe P-1 in the earlier screenshot.
OPC Source
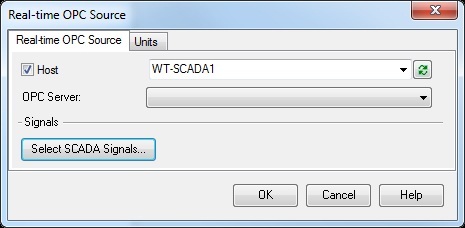
The OPC Source type gives WaterGEMS users the ability to connect to the OPC server and allow the user to communicate directly to the same interface that SCADA operator uses. There are two types of OPC connection, Real-time and Historical.
If the OPC server is in the same machine as WaterGEMS, click on the drop-down next to OPC Server: and select the server. If OPC server is in another computer (which can be remotely reached at) then put a check on Host and then click "Refresh" button.
If your server does not show up in the dropdown, try opening the 32-bit version of WaterGEMS using the WaterGEMS.exe file from within the root of the installation folder. This is necessary in cases where the OPC client is 32-bit, as WaterGEMS will default to opening as 64-bit.
Usually the SCADA system is protected from the Internet or other outside threats by a firewall or other security measures, allowing you to connect with the OPC server directly or export the file with data needed to SCADAConnect. A more secure alternative is to use OLEDB along with custom SQL statements.
For troubleshooting problems with an OPC source, see the "tips" section of this article: How can I publish my computed model results to a SCADA HMI? (or consider the OLEDB approach)
Once the source is selected, click on the Select SCADA Signals button and add the interested signals towards the right list, in the new window.
Citect Source
The Citect Source enables the user to bring data from a Citect server/database directly to SCADAConnect Simulator. After selecting Citect Source from the New button, click on Edit button.
For the Remote Server, enter the server name if WaterGEMS is on a different machine than the Citect Server. If WaterGEMS and the Citect are on the same machine, this does not need to be provided. For the Authentication, if a user name and password is required, include that here. Once this information in filled in, choose Test Connection and make sure you get the "Connection succeeded" message. Click OK until Citect Source window is active.
NOTE:
- We strongly recommend that you connect directly to the Historian if possible, instead of using a connection like Citect. This is a Best Practice as the Historian will be read-only and is typically outside of any SCADA firewall.
- Only version 7.2 and 7.4 of Citect are tested and supported.
Next, select SCADA Signals button. Add the signals to right side of the list either by double-clicking or by clicking > sign. The ">>" will add all the signals to the list in the right. Click OK to close the window and back on Citect Source window. Click OK again to close the Citect Source window.

Now, the SCADA Signals window will show the list of the SCADA Signals and their value.
Assigning Data
Now that WaterGEMS knows what model elements are associated with the SCADA signals and where tags in the SCADA file are located, the SCADA elements need to be matched with the tags. This can be done element-by-element in the property grid or more quickly by opening the SCADA Element FlexTable.

How you assign the data will depend on what kind of data it is: real-time or historical. If you are using historical data, find the column for “Signal (Historical).” For each row of the FlexTable, pick the SCADA tag associated with that element. When done, the table should look like the screenshot above. (If you are using real-time data, you would use the “Signal (Real-time)” column in the FlexTable.)
Derived Signals
Starting with WaterGEMS CONNECT Edition Update 3 (version 10.03.01.08), you can now choose between using raw data or formula-derived SCADA data.
In addition to the raw signal data directly pulled from the data source, there are now derived signals which take raw signals from the same data source and transform them based on a user defined formula. This makes it easier for you to bring in signal data exactly the way you want. These Derived Signals, once created, work like raw signals when setting up SCADA Elements.
To create a derived signal you can right-click on the “Derived” node under the data source which contains the raw signals, then select “New” or right-click the signal you want to derive from and select “Create derived signal from..."
In the dialog that opens, you can enter a label and select the transformation method (Formula or Override). If you choose Formula, there will be a Formula tab. Click the ellipsis ("...") button. You will be able to apply a formula to an existing SCADA signals using a number of math functions.
Note: there is a known issue with performance when using derived signals with a large number of data points (reference # 1374947). This has been resolved in a patch for version 23.00.00.19. Please contact Support for help or upgrade to a newer version when available. Also, it is recommended that you use a tolerance (forwards/backwards) as big as necessary, but no bigger, as it may impact performance slightly if set too large. For points that are expected to be at a frequency of 1 minute for example, a tolerance of +/- 5 minutes (or less) would be advisable unless there was a specific reason to go wider than that.

Computing and Results
Now that the data is assigned to the SCADA elements in the model, you are ready to compute. The steps you take will depend on what you are trying to do.
Open SCADAConnect Simulator, if you have not already. With the setup complete, an operator can basically do whatever they need to in order to analyze the system and add SCADA data to the model. This includes new features related to pipe breaks and fire response runs.
If all you need to do is to run a model with historical or real-time data, you are ready to simply compute. At the bottom of SCADAConnect Simulator, set the Baseline Scenario to the scenario you are computing. In the screenshot above, this is for a scenario using the historical data from an Excel spreadsheet. Click the Compute button and the model will run. SCADA Data and model data for the associated element will now be available in the SCADA Element FlexTable.
With Historical SCADA data, this can help with model calibration and to make sure that the model response is accurate. Live SCADA runs can also help with this, but can also be used in real time to make sure that pumps and valves are working correctly and that flow and pressure results are accurate. The latter could be important in finding places where there might be leaks or valves that are partially closed. The Live SCADA data can also use an auto-compute function. If the operator sets the calculation option to use Auto-Compute, the program will compute automatically on a regular basis

There may be cases where you want to adjust the demands or change the controls that the model uses. With SCADAConnect Simulator, you can do this without the need to make physical changes to the model files themselves.
Demand Adjustments
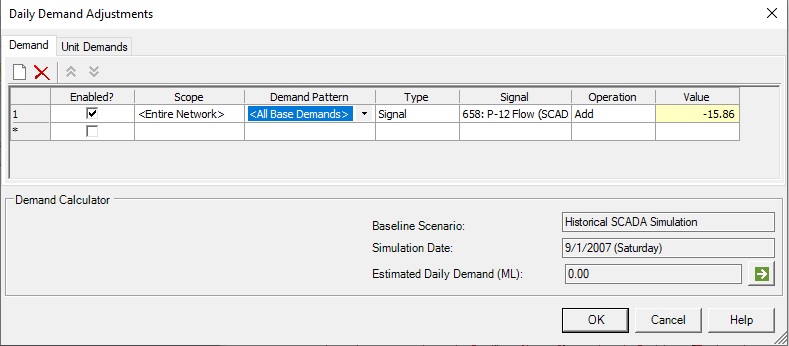
For demand adjustments, right-clicking on “Daily Demand Adjustments” in the middle of the SCADAConnect Simulator dialog will allow you to edit the demands or unit demands. You select the scope that you want to use, choose the demand pattern that you want to use, set the operation of the value set. In the lower right corner of this dialog you can use the compute button to estimate the total daily demand. When you create one of these, it appears in the tree form list beneath Demand Adjustment.

Signal Based Demand Adjustments
Starting with WaterGEMS CONNECT Edition Update 3, source and Signal options have been added to the Demand Adjustments. This enables you to be more flexible in choosing whether to manually adjust demands or populate them from a signal. When you open the Demand Adjustments, you can now choose a source, either User Defined or Signal. If Signal is selected, you will be able to choose from the available SCADA Signals available for the model. The closest available signal value to the start time of the simulation will be displayed and used in the Value field.
Control Overrides
You can also override controls that might be present on elements in the model. For instance, there may be a control on a pump in the system where it turns off at a certain level. However, in your SCADA run, you would like to change that level to something else without changing the control in the baseline model. Another example would be a case where a valve is manually operated at a certain time and you need to account for that (and it is not already set as a logical control in the model based on logic)
To set control overrides, right-click on Control Override in the main SCADAConnect Simulator window, to open the dialog below:

This enables you to create control overrides to quickly assess study situations. To create a control override, right-click on Control Override in the middle of the SCADACOnnect dialog and select the New button at the top of the window. Select the element to be controlled by clicking the ellipsis button in the “Controlled Element” column. Select the attribute of the element to change in the next column, set the value of the element, start date and start time for the control, duration for the control, the priority, if any, and any notes about the control. When you create one of these, it appears in the tree form list beneath Control Override.
Note that control override parameters are the same as the ones available in the standard Controls feature. For example to control a TCV valve, you can choose between the TCV Status (active, inactive, closed) or the TCV Setting (headloss coefficient, K).
Starting with WaterGEMS CONNECT Edition, Control Override information can now be imported into SCADAConnect Simulator. In earlier versions of SCADAConnect Simulator, control overrides (cases where you may want to apply different controls than what is currently in the scenario) needed to be applied manually. With WaterGEMS CONNECT Edition, you can now import historical pump information to automatically create the controls in the model and apply the overrides. In SCADAConnect Simulator, select the Configure tab and choose Import Historical Overrides. Note: Starting with WaterGEMS CONNECT Edition Update 3 (build 10.03.00.69), you can now automatically import control overrides when using the Historical or Historical (Live Training) simulation modes. If there are control overrides that are outside of the Difference Tolerance value, the control overrides will be automatically imported. The user can opt to set this automation field to False and manually update the control overrides.
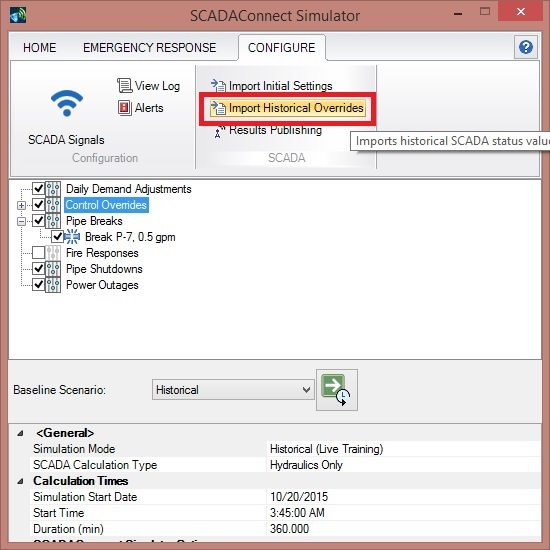
This will open a new dialog that will allow you to import the controls from an existing source file. The SCADA Signals will already need to be set up the correct source to do this. The SCADA Elements will appear in the box in the lower left. The control override can be filtered for a certain time span.
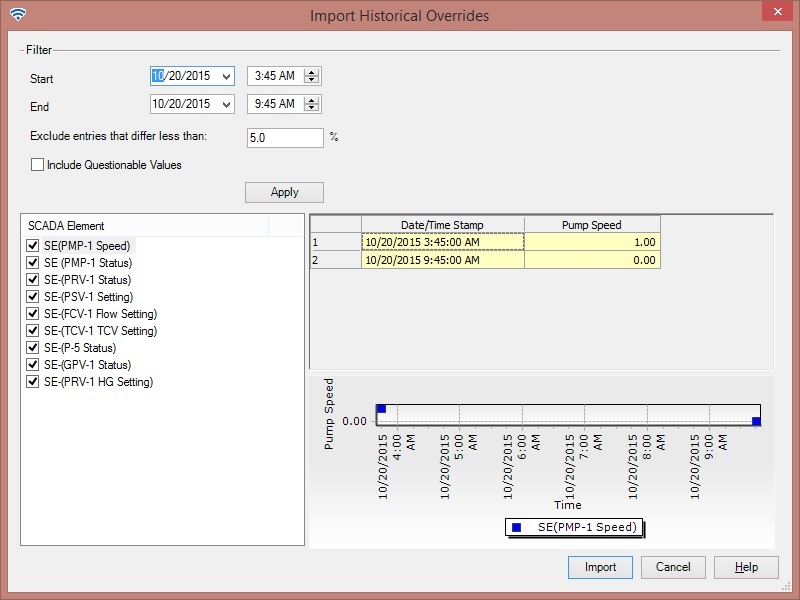
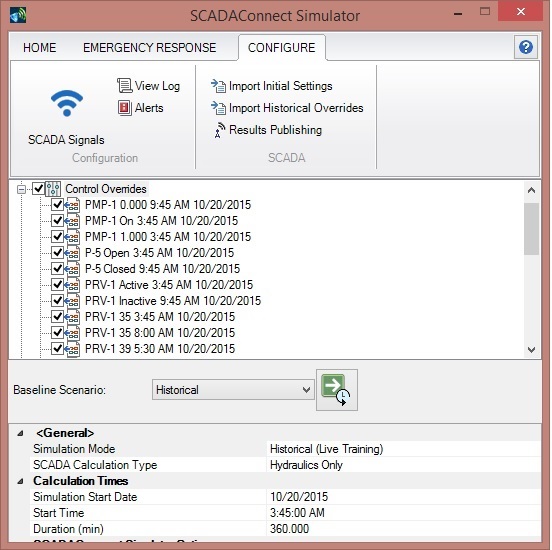
Once you have that selected, click the Import button to import the control overrides. They will then appear in the middle section of the SCADAConnect Simulator dialog.
General Features
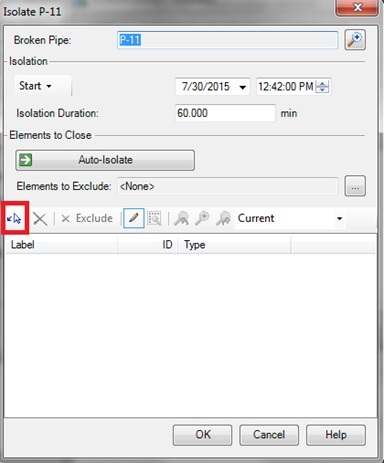
Auto isolate pipe break tool
Clicking the “Auto-Isolate” button will automatically select the closest elements (such as isolation valves that are available to close off this pipe from the system and add them to the bottom portion of the window below. You can also choose to select the elements from the drawing using the “Select in Drawing” icon (outlined by the red box). You can also exclude certain elements from those you want isolated, highlight all the elements that are included in the run using the Highlight button, zoom to a selected element in the drawing for easy location, and quickly zoom in or out of the drawing using the drop down menu that allow you to scale your model by current view or a percentage of the current view (25%, 50%, 75%, 100% - 400%). This will allow you to easily identify the area that you are studying while allowing you to examine what happens in other parts of the model while the break scenario is running.
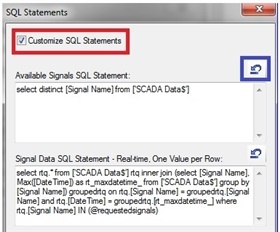
Customized SQL Statements for optimal performance
This new feature will allow you to accommodate any SQL extensions that your database may support, opening potential support for other data historians such as GE Proficy. In order to enable customization, click the checkbox for the "Customize SQL Statements,” which will make the statement text boxes editable. If you make a mistake or want to reset the statements to the default you can click the "Reset to default" button that his highlighted by the blue box in the screen show below.
This feature can be very useful to connect to your data source via OLEDB, which is typically a more secure method when compared to OPC. See more details here: How to define real-time custom queries in SCADAConnect
To locate this feature, click the SCADA Signals button on the Configure tab to open the SCADA Signals window, then right click on the folder label and choose "Edit Data Source..."

Added intermediate time steps for control overrides and fire flow demands
While this change cannot be seen visually, it will allow time steps to be inserted by SCADAConnect Simulator for hydraulic calculations when a control override is applied or a flow demand is added or removed. This will improve the accuracy of the calculation results.
Network Demand Calculator
Right-clicking on “Daily Demand Adjustments” in the tree view allows you to edit the demands or unit demands without changing the input of the main model itself. You can select the scope that you want to edit by selecting a selection set (or leaving the default of “Entire Network”), choose the demand pattern that you want to use (the default is “All Base Demands”), and set the operation (add, divide, multiply, subtract, or set) of the value you define. This allows you to quickly adjust demands that will be used when you compute through SCADAConnect Simulator. In the lower right corner of this dialog you can then use the green compute button to estimate the total daily demand given your adjustments.

Signal Value Mapping for translating SCADA signal values and formats
SCADA signal values can be mapped to a raw signal value in the Database Source dialog. This takes into consideration that SCADA signal values may have varying formats and provides additional flexibility to transform these values into a form the software can interpret. This new feature can be accessed in SCADAConnect Simulator by going to the Configure and choose SCADA Signals, or my going to the Components pulldown menu from the main interfact and selecting SCADA Signals. Available options for the status types are <no mapping>, Threshold, and Single Value. The Threshold type allows the use of operators =,!=, <, <=, >, >=, and <none>. When the Single Value type is selected, only = and <none> are available.
Also, in the units tab you can specify source data units, in case they differ from the desired model units. Note: as of the CONNECT Edition (10.00.00.50), the ability to transform with a custom conversion factor is not yet possible. For example if your pump relative speed is defined as a percentage in the SCADA data source, WaterGEMS currently only has unitless multipliers available for the relative speed factor, so you cannot select percent as the unit. As a workaround, you would need to perform the conversion externally and modify the data source before import. For example manipulation in Excel.

Emergency Response Tools
There are four tools available in SCADAConnect Simulator for WaterGEMS CONNECT Edition. Two of these tools are available in WaterGEMS V8i SELECTseries 6. These are Pipe Break, Fire Response, Power Outage, and Pipe Shutdown.
Pipe Break
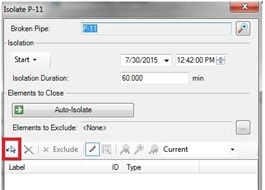
The Pipe Break option enables the user to specify a pipe break or a shutdown of a portion of the distribution system. (A shutdown is simply an isolated pipe break with zero leak flow.) You can create a new Pipe Break multiple ways. You can right-click on Pipe Break in the tree form. From the Home tab, you can click the New button and then choose Pipe Break. From the Emergency Response tab, you can choose Pipe Break Response. Any other these options will generate a Select tool bar to allow you to choose a pipe. After selecting the pipe, the following dialog is displayed.

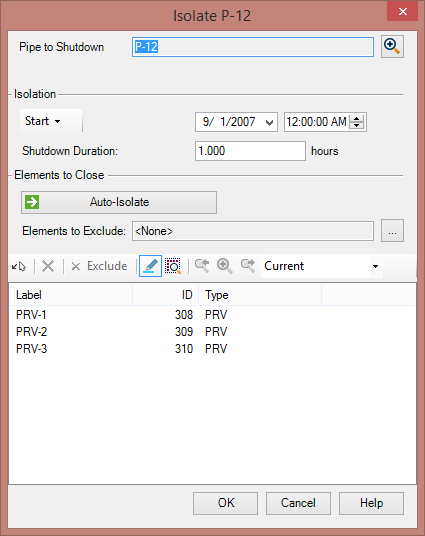
You can set the leakage flow rate and choose the start time to isolate the break by checking the isolate break checkbox. Clicking the checkbox allow you to set the date and the time to run the simulation, as well as input an isolation duration. Enabling the checkbox also enables the “Isolate Break” button, which opens the window shown below.
Clicking the “Auto-Isolate” button will automatically select the closest isolation valves that are available to close off this pipe from the system and add them to the bottom portion of the window below. See the New Features section above for details on this feature.
When a Pipe Break is active, an icon will appear in the drawing page, showing where this will occur.

Video demonstration of Pipe Break:
Starting with WaterGEMS CONNECT Edition Update 2 (build 10.02.03.06), the user can now visualize the outage area for a pipe break. This will be useful for an operator wants to see the pipe segments that will be offline when a pipe break is isolated.
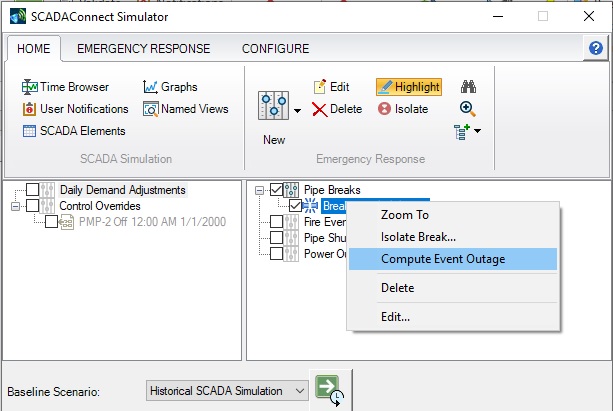
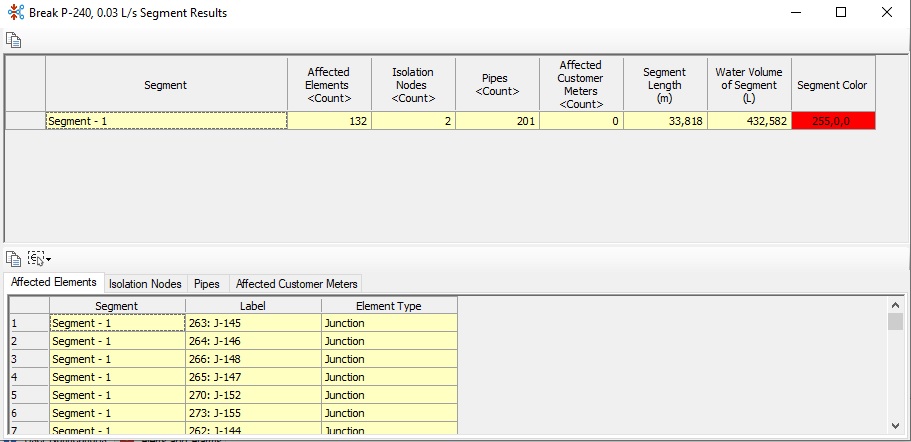
Note: Starting in the CONNECTION Edition Update 3 (version 10.03.01.08) release of WaterGEMS's SCADAConnect Simulator, there are improvements to the Pipe Shutdown Event. A Select Elements in Drawing button has been added so you can quickly view affected elements. To access these, right-click on a Pipe Shutdown event and choose Compute Event Outage. The outage segment for the pipe shutdown will be highlighted and a table will be generated with the affected elements.
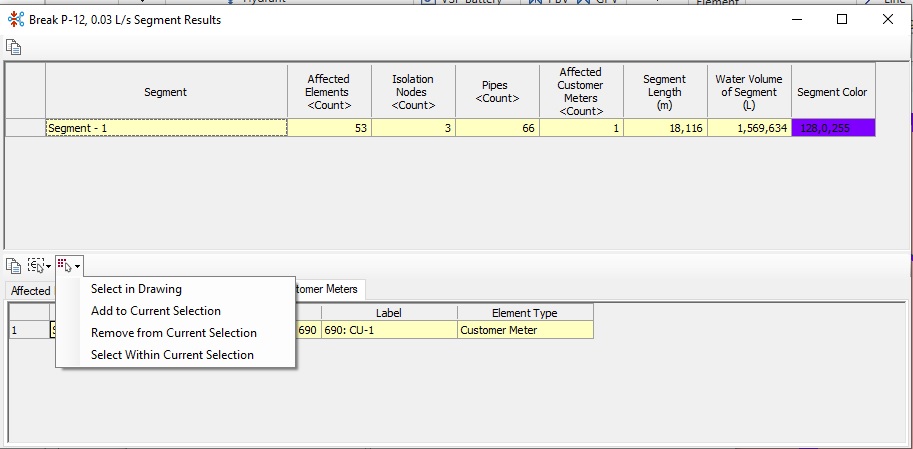
An outage polygon can also be displayed, giving the operator a good visual representation of the impact of an outage.
Fire Response
Fire Response enables the user to place a fire demand (or other emergency flows) at a junction for a period of time to determine its impact on pressure and flows and possibly test alternative ways of responding to the fire. Like Pipe Break, you can create a new Fire Response multiple ways. You can right-click on Fire Response in the tree form. From the Home tab, you can click the New button and then choose Fire Response. From the Emergency Response tab, you can choose Fire Response. Any other these options will generate a Select tool bar to allow you to choose a junction or hydrant. After selecting the node, the following dialog is displayed.

The new fire response dialog is similar to the pipe break dialog, except in here you define the demand node and demand that you want applied to that node instead of supplying a leakage flow. After running the fire response you can easily use the time browser button at the top of the home tab along with the graphs button to view how your model responds over time.
When a Fire Response is active, an icon will appear in the drawing page, showing where this will occur.

In the middle part of the Home tab, you will see any demand adjustments, control overrides, fire responses, or pipe breaks that you include in your run. If you do not want to have these applied when you compute, you would simply uncheck the box beside. Similarly, this tree form allows you to have multiple items, such as two fire responses. You may not want to have both apply for a given run and in such a case, you would uncheck on fire response in the tree form and leave the other checked, similar to what is shown below.
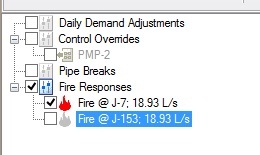
The tree form also always you to edit existing items by right-clicking on an existing item. When you right-click on an existing item, you also have a Zoom To option, which will highlight the item in the drawing.
Power (Pump) Outage
Power outage events enable the user to mark pumps or variable speed pumps as being affected by a power outage. As part of the SCADAConnect simulator tool, this provides a simple interface for an operator to simulate the impact of such an event.
This tool is accessed from the Emergency Response Tab in SCADAConnect Simulator.
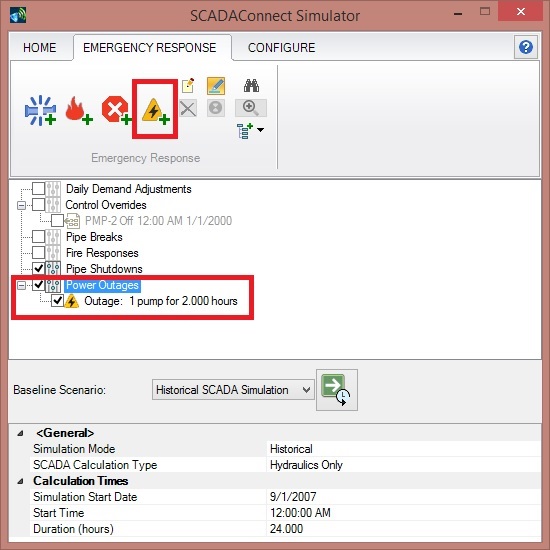
There are two ways to access this. You can either right-click on the Power Outage selection in the middle of the dialog or you can click the "Quick Add" button at the top of the SCADAConnect Simulator dialog. This opens a Select toolbar that allows you to select pumps that may see or have seen a power outage at some point. Once the pumps have been selected, you can enter the data in the Power Outage table, including the start of the outage and the length of time it runs.
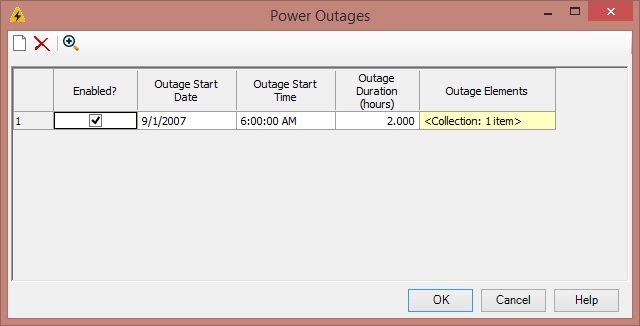
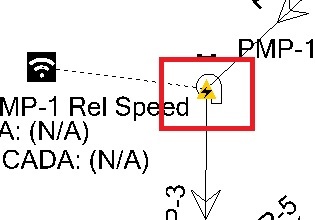
This will allow you to account for an outage during an historical simulation or to plan for an outage in real-time simulations. When the run is computed in SCADAConnect Simulator with a Power Outage applied, the solution will include the results when the pump is not available. You can include multiple power outage events in the simulation. If the event does not need to be included, you can uncheck the box in the Enabled column. When the pump is enabled for a power outage, the symbol below will appear over the pump in the drawing pane.
See:
Pipe Shutdown
Pipe shutdown events enable the user to shut down a portion of the distribution system and simulate the results of doing so. This allows an operator to simulate the impact of the closure of a pipe, in a simple interface.
This tool is accessed from the Emergency Response tab of the SCADAConnect Simulator.
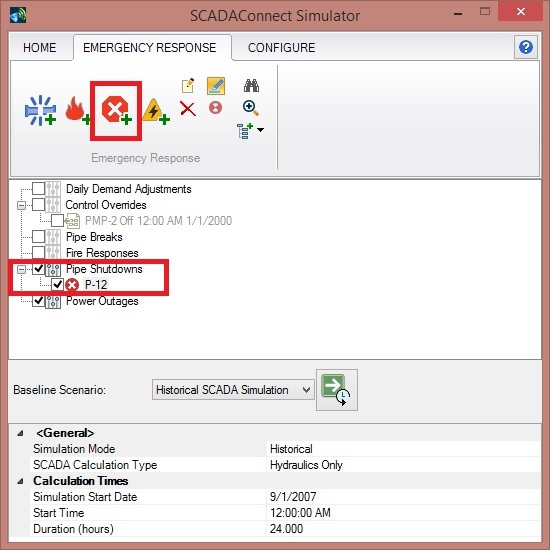
There are two ways to access this. You can either right-click on the Pipe Shutdown selection in the middle of the dialog or you can click the "Quick Add" button at the top of the SCADAConnect Simulator dialog. This opens a Select toolbar that allows you to select pipe or pipes that are part of the pipe shutdown.
Once the pipes have been selected, you can enter the data in the Active Pipe Shutdowns table, including the start time of the pipe shutdown and the length of time it lasts. Since the pipe shutdown involves closing valves or pipes, the next step is to isolate the pipe. The Auto-Isolate button at the top of the Active Pipe Shutdowns table allows for a simple way to do this.
Click the Auto-Isolate button and the program will populate the valves needed to isolate the pipe. If there are no isolation valve or other valves in the model in that part of the system, the user can select pipe elements to close. It is up to the user to ensure that these pipes have sufficient valves to accomplish this isolation.
During the time that the shutdown is isolated, the flows in pipes in that area are zero and the demands are zero. The hydraulic grade and pressure in the isolated area will not have valid results.
Viewing Results
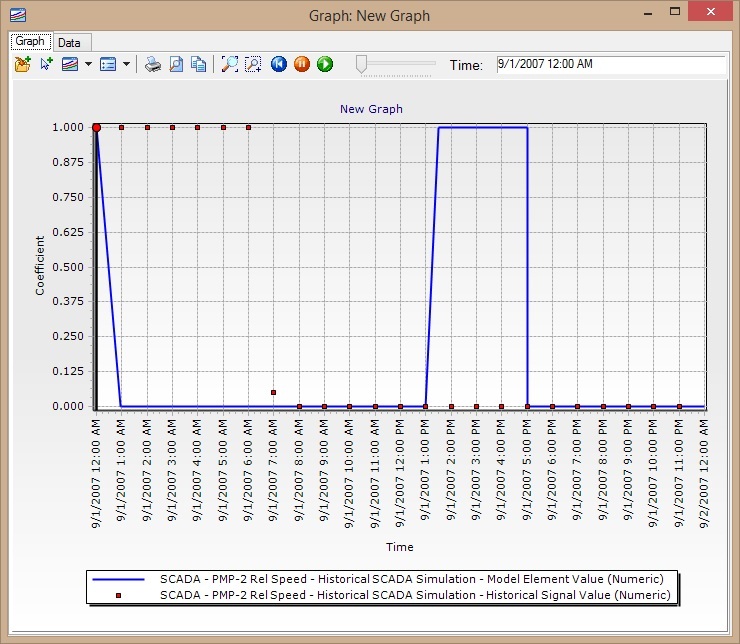
The SCADA data can be used to help calibrate a model by comparing data from the SCADA system with model results. There are several ways to do this. Comparing graphs is one way. In SCADAConnnect Simulator, there is a Graphs button. Clicking this will open the Graphs manager. Choose the New button, then Line-Series Graph. The Select toolbar will open. Choose the SCADA Element you want to graph. The line data will be the model results; the points will be the SCADA values from your data source.
To create a graph, you can also go to the drawing in the main user interface, right-click on the SCADA Element, and select Graph. This graph will not automatically be saved to the Graph manager, but you can add it by clicking the “Add to Graph Manager” button.
Numerical results can also be viewed from the SCADA Element FlexTable, though this will only be for the current time step. You can use the time browser to step forward in time to see the results change. This can be useful if you want to see the results for all SCADA Elements for a given time step.
For viewing results from a a tool like Pipe Break, Fire Response, Power Outage or Pipe Shutdown, there is not going to be a SCADA element to graph. Instead, you would graph the element associated with what you are modeling and/or the elements around it. For instance, assume you have a Fire Response where an additional fire demand is applied to a node for 1 hour. After computing this, you can graph the pressure at that node to see how the additional demand will impact the pressure at that location. You can also graph the pump flow or tank level to see that response.
The Named Views option can be useful to quickly zoom to a section of interest in the drawing pane. First, zoom to a section of the model that you are interested in. In SCADAConnect Simulator, choose the Home tab and then Named Views. In the dialog that opens, click New > Named View. This will save this view. If you zoom back out and select the Named View from the dialog, it will zoom right back to the extent of the Named View.

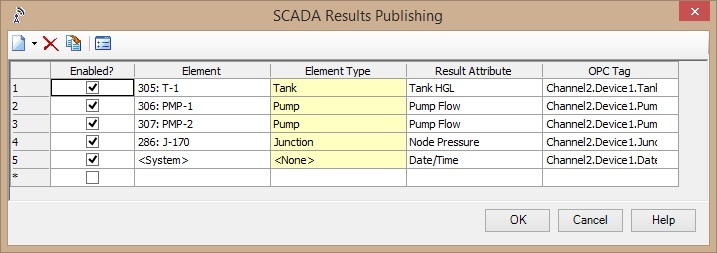
SCADA Results Publishing is a feature applicable to the OPC Source. This tool basically defines how things are mapped from the hydraulic model to the OPC. If results from an element are desired to display in an existing OPC then this tools comes into play. In order to push the result, the simulation must be run from SCADAConnect Simulator.
The View Log button can be useful during troubleshooting when the feature does not behave as expected. Clicking the highlighted button will open up the log file in a notepad.
Troubleshooting
The pump status was not displayed after computing the model.
This is likely because the status is a text string and needs to be mapped to the On/Of property. This is done by going back into the SCADA Signals dialog (Components > SCADA Signals). Double-click on SCADA Data Source you are using, or right-click and choose “Edit data source.” Select the Signal Value Mappings tab. In the Pump Status Section, pick Single Value from the Type pulldown menu, and set On to “On” and Off to “Off.”
I can see the graph in SCADA Signal Editor but not in the Graphs
If data and graph are visible in SCADA Signal Editor but not in the graphs, then it most likely due to the date. Please make sure the data in the Calculation Options and the date when data were recorded are the same.
Data in the signal editor and SCADA element graph is truncated (stops after a certain time).
First, check the dates in the signal properties. If the interval is small, you may also be running into a limitation with your Historian. For example with ClearSCADA, historical data queries are performed against the cached data, and there is a way to control a cache-size on the ClearScada server. (link)
OPC Publishing does not work correctly with pump or valve status
First note that OPC publishing will export the "Is Open" status, so "1" (true) for open and "0" (false) for closed. You may also need to use the FLOAT data type. See: How can I publish my computed model results to a SCADA HMI?
SCADAConnect Simulator Calculation progress freezes or hangs (calculation type = SCADAConnect Simulator)
A known performance issue (reference # 1095442) causing slow connection, freeze or hang has been addressed in a patch for version 10.03.00.69 (and also included in newer versions). Check for and upgrade to a newer version if available, or contact Technical Support for the cumulative patch set for version 10.03.00.69.
I want to view a detailed log for troubleshooting purposes
You can use the "View log" button in the Configure tab. For more on this, and how to enable verbose logging, see: How to obtain log information for SCADAConnect
Starting with Connect Edition update 3 version, there is improvement in the robustness of SCADA connections, connection life time and other improvements to OPC connection handling with a view to avoid potential problems when very large numbers of signals are being utilized.
This improvement in error logs of SCADA also enables more detailed logging which can help us troubleshoot further, via verbose logging. Having this option enabled will facilitate the collection of additional diagnostic information for SCADA connections, particularly OPC connections.
If you are using Connect Edition update 2, 10.02.01.06 version, then patch has been developed for this version, to get this patch please contact technical support.
I cannot see the signals selected after clicking on "Select SCADA Signals"
This issue was reported when connected to an SQL datasource to obtain signal data. This could be related to the server timing out when the signals are queried leading to no signals being selected. To identify this, please follow the steps provided above to get the detailed log file. Check the log file to see if there is a server timeout issue. You can see 'connection opened' and 'connection closed' messages in the log frequently one after the other indicating that the connection with the server is timing out.
This could mean that there is a problematic query which is having difficulty in fetching the signals resulting in server timeout. To troubleshoot this, try running the exact problematic query in your tool or in SQL Server Management Studio, to see if it also times out. If the server times out again, you would have to specify a custom query and enter the query that does work for you. To do this, click the "SQL statements" button at the bottom of the Database Source window, check the box for "customize SQL statements" and edit the first field "Available Signals SQL Statement". See more here: How to define real-time custom queries in SCADAConnect
There is also some information in the following article which you may find helpful: Slow Distinct query in SQL Server over a large dataset
Unable to import large number of SCADA signals
If you have a good connection for the SCADA signals, but have a large number of signals, you may need to break this up into multiple SCADA connections. Another possibility would be to investigate how to increase the timeout for the connection. This setting may be configured on the server side. This link has information on this.
Citect-related
I am getting an error message “Citect API dlls are missing...”
Please navigate to this page.
When doing a Test Connection with Citect, the following message is generated: “Unable to open the Citect connection”
Make sure the server name is spelled correctly and can be pinged from the command line. Try with and without the Authentication.
When doing a Test Connection with Citect, the following message is generated: “Citect is not available when running as 64-bit”
Make sure to run the 32-bit of WaterGEMS/CAD and that you are using version 7.2 through 7.4. For more details click here.
When using Citect, it will still not connect
Try to enable a legacy connection. Step are shown in this page. Also, make sure that the CtAPI dlls version is the same as the Citect version and that you are using version 7.2 through 7.4.
FAQ
Q: Is SCADA Connect simulator available within ArcGIS Pro?
SCADAConnect simulator is fully compatible and functional with the integrated version of WaterGEMS software for ArcGIS Pro.
See Also
Free Webinar on SCADAConnect in SewerGEMS
SCADAConnect Simulator in WaterCAD and WaterGEMS V8i SELECTseries 5
SCADAConnect in SewerGEMS
How can I publish my computed model results to a SCADA HMI?
How to define real-time custom queries in SCADAConnect