| |
Product(s): |
WaterGEMS |
|
| |
Version(s): |
08.11.XX.XX, 10.XX.XX.XX |
|
| |
Environment: |
N\A |
|
| |
Area: |
Output and Reporting |
|
| |
Subarea: |
N\A |
|
Problem
When closing a graph and opening it again the formatting changes. More specifically, it appears that the formatting is being applied to a different series. This has been reported in graphs that contain both time series field data and standard calculated data.
For example, when the graph is opened the first time the time series field data is displayed as points and the calculated data is displayed as lines:
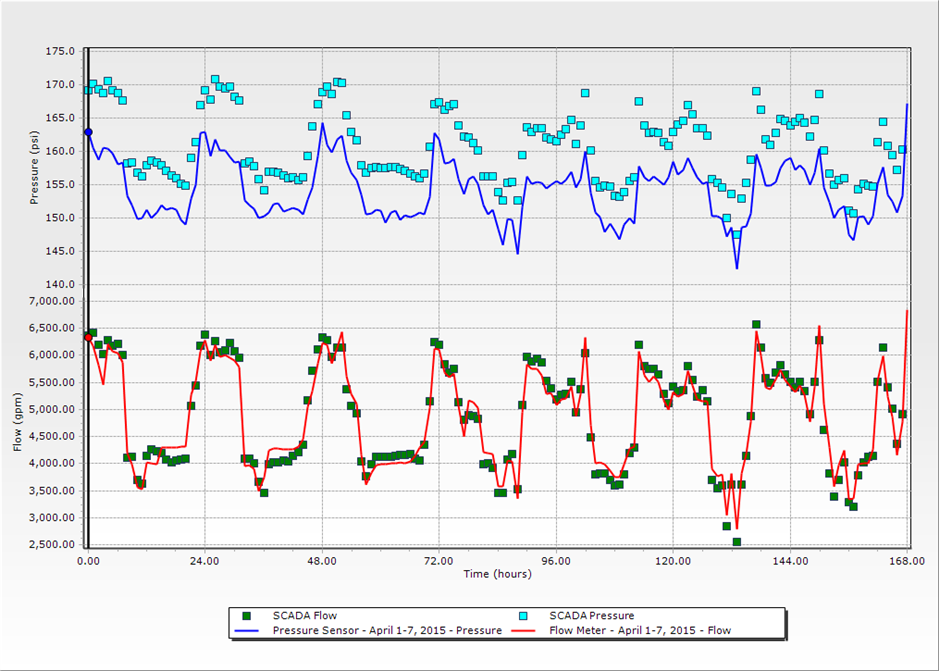
After closing that graph and reopening it, the time series field data is displayed as lines and the calculated data is displayed as points:

Defect #434496 was created to address this.
Solution
Download the latest patch set (dated May 9th, 2016 or later) to prevent this from happening in the future. Graphs that have already been changed will need to be manually changed back to the correct formatting. This can be done easily by clicking on the down arrow next to the Chart Options icon and selecting "Restore Factory Default Chart Options".
See the following links for more information on Bentley Hydraulics and Hydrology product patch sets.
Cumulative patch sets for Hydraulics and Hydrology products
How can I find out when a new version or patch is released for a Hydraulics and Hydrology product?
See Also
Forum Thread: Set default symbols for graph

| |
Original Author: |
Craig Calvin |
|