| |
Product(s): |
StormCAD |
|
| |
Version(s): |
10.00.00.40, 10.00.00.45 |
|
Overview
The CONNECT Edition release of StormCAD introduces fixes to various user-reported problems and other general improvements. Let's explore each of these in detail.
Note: this article only covers the enhancements new to version 10.00.00.40 and 10.00.00.45. For information on even more enhancements new to the CONNECT Edition of Bentley's storm and sewer products, see:
What's new in StormCAD CONNECT Edition Update 1
What's new in StormCAD CONNECT Edition Update 1 (Build 10.01.01.04)
Video Overview

List of Topics
Compatibility
Interface
Layout & Data Input
Calculations
Results
Usability Enhancements
Supported Operating Systems
- Windows 10 (32-bit or 64-bit)
- Windows 8 (32-bit or 64-bit)
- Windows 7 (32-bit or 64-bit)
Compatible Platforms
- StormCAD CONNECT Edition standalone version does not require any CAD or GIS software to work. However, it can be integrated with the following platforms:
- MicroStation V8i SELECTseries 4 (Note: MicroStation CONNECT Edition integration is not yet supported with this release)
- AutoCAD 2016, or 2017
See:
Wiki Platform Compatibility
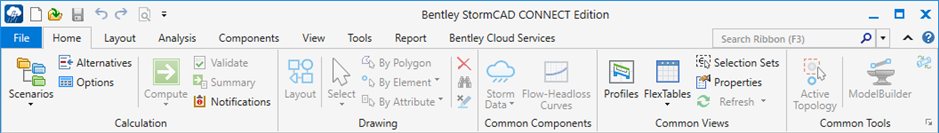
Ribbon Interface
A new ribbon user interface has been added to the stand-alone products.
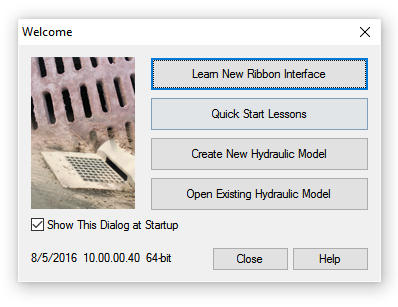
A button has been added to the welcome dialog to provide quick access to the ribbon interface help documentation.
The application menus match the platform the program is integrated with. MicroStation V8i does not use a ribbon user interface. Therefore this release of the Storm and Sewer products will not use the ribbon interface when integrated with MicroStation.
The following article provides an in-depth look at the new ribbon menu.
Ribbon Interface for Storm and Sewer CONNECT Edition products
File and Help Menus
When the File tab is selected, the entire program dialog switches to display the File menu (ie. "backstage").
The Help menu and Database Utilities have been moved to the File menu.
Background Images
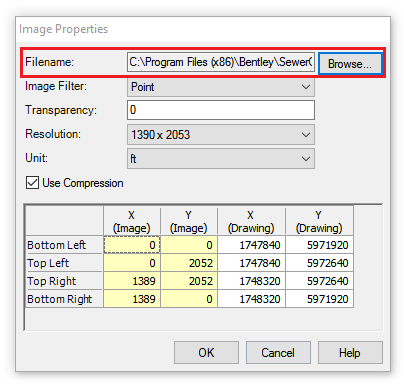
View and edit the path for background images
The Image Properties dialog now displays the image's filename and includes a Browse button to edit the field.
Improved background layer performance
Background layers are now loaded more efficiently so that less memory is consumed. This improvement is especially helpful when using multiple large files for background images.
World file support for background images
Some image formats support associated world files. When attaching a background image file that has an associated world file present, the image will now be spatially located automatically (ie. georeferenced).
The following file formats support an associated world file.
- bmp
- jpg
- jpeg
- jpe
- jfif
- tif
- tiff
- png
- Gif
The World file extension is based on the image's extension. One convention is to use the first and last letter of the image's extension and add a "w" (eg. .jpg>.jgw). Another convention is to append the image's extension with a "w" (eg. .jpg>.jpgw).
When opening the file, the Image Properties dialog will automatically enter the coordinates from the World file in the editable (Drawing) fields.

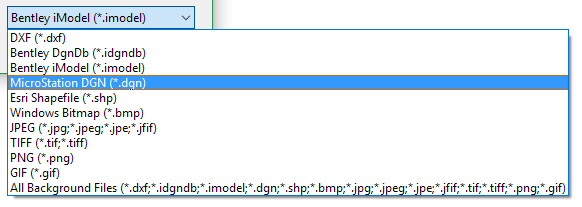
Bentley file format support for background layers
The following Bentley CAD file formats are now supported as background layers:
New Element
This release includes a new element type; property connection.
Property Connection
Property connection elements are used to load sewer models based on data at the level of individual properties. This is primarily used with sewer models, but is still available in StormCAD. This is useful when you have loading data provided for customers/properties based on metering, number of occupants/fixture units, or simply flow per property. Including all property connections in your hydraulic model is useful when there is a need to have a closer (one-to-one) match with your GIS. Being able to see all property connections in the hydraulic model allows you to get a more detailed view of where the individual loading occurs, rather than lumping many loads into one manhole.
Property connections are used for loading in the Explicit and GVF Convex solvers, but not the Implicit solver. Property connections support hydrograph inflows, pattern loads, or directly accept runoff as the outlet of a catchment. For the GVF Rational Solver, flow through a Property Connection must come from a Catchment. (Property Connection designated as the Outflow Element.)
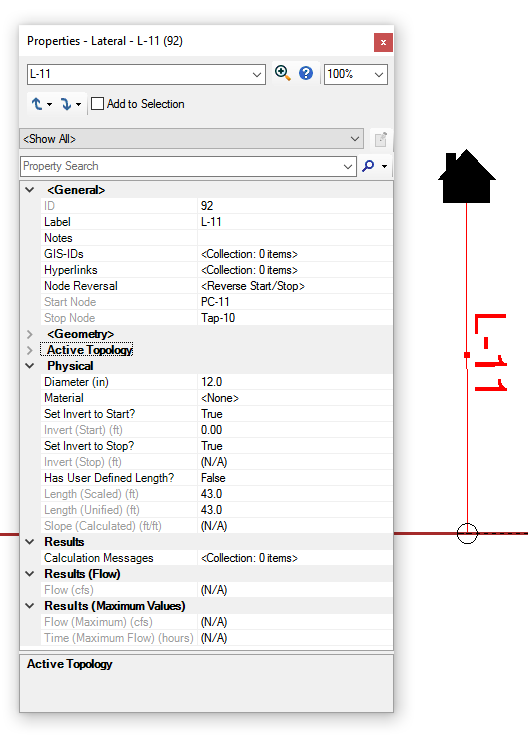
Inflow/loading from a property connection element would typically enter your network via a Lateral link that connects to a conduit via a tap node.
See:
Automated Catchment Delineation
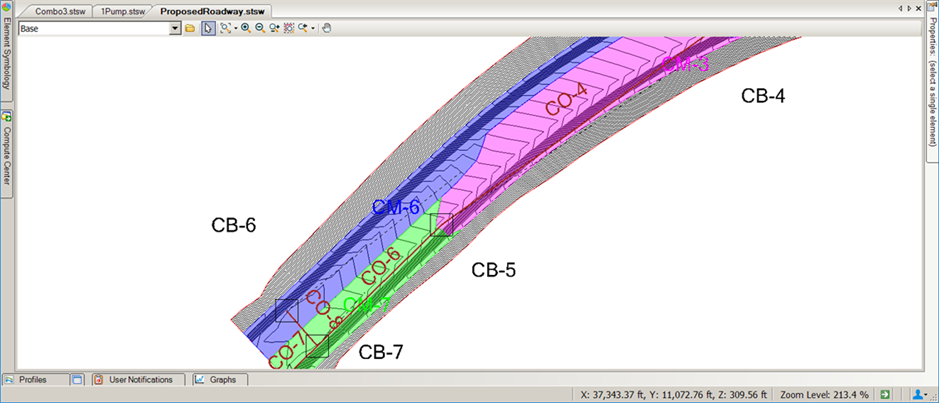
The new Catchment Delineation tool is a terrain model analysis system designed to find the catchment area with runoff flow path ending at a low point or passing through an inlet surface area. It automatically finds catchment boundary points for inlets, calculates catchment properties, and derives gutter network and gutter properties.
This tool allows you to create catchments inside StormCAD based on a terrain model and interactively update them, without having to use an external application to do so.
Note: Bentley terrain model and its functions are used in running catchment delineation.
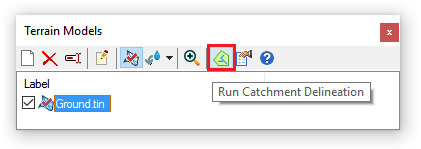
When the Run Catchment Delineation is selected from the Terrain Modeling Manager, the button for Catchment Delineation will be placed in the depressed position. At this time, whenever a catch basin is added or moved within the Digital Terrain Model (DTM) the catchment is identified or updated.
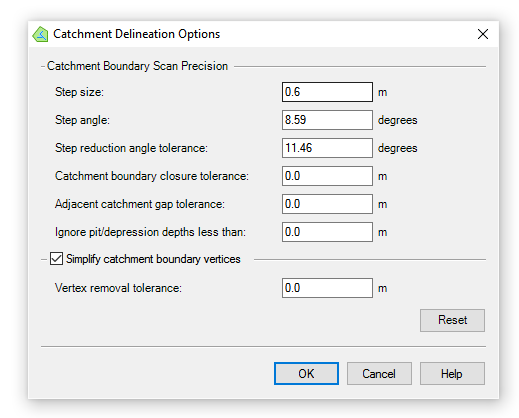
Selecting Catchment Delineation Settings from the Terrain manager opens the following dialog where the user can adjust parameters that control the catchment delineation tool behavior.
See:
HEC-22 3rd Edition
Various improvements have been made to the HEC-22 3rd edition structure loss calculations to bring better compliance with the HEC-22 Standard.
Profiles
Engineering Profile Annotation Table
Engineering profiles now have the option to include an annotation table which is drawn similar to the analysis profile.
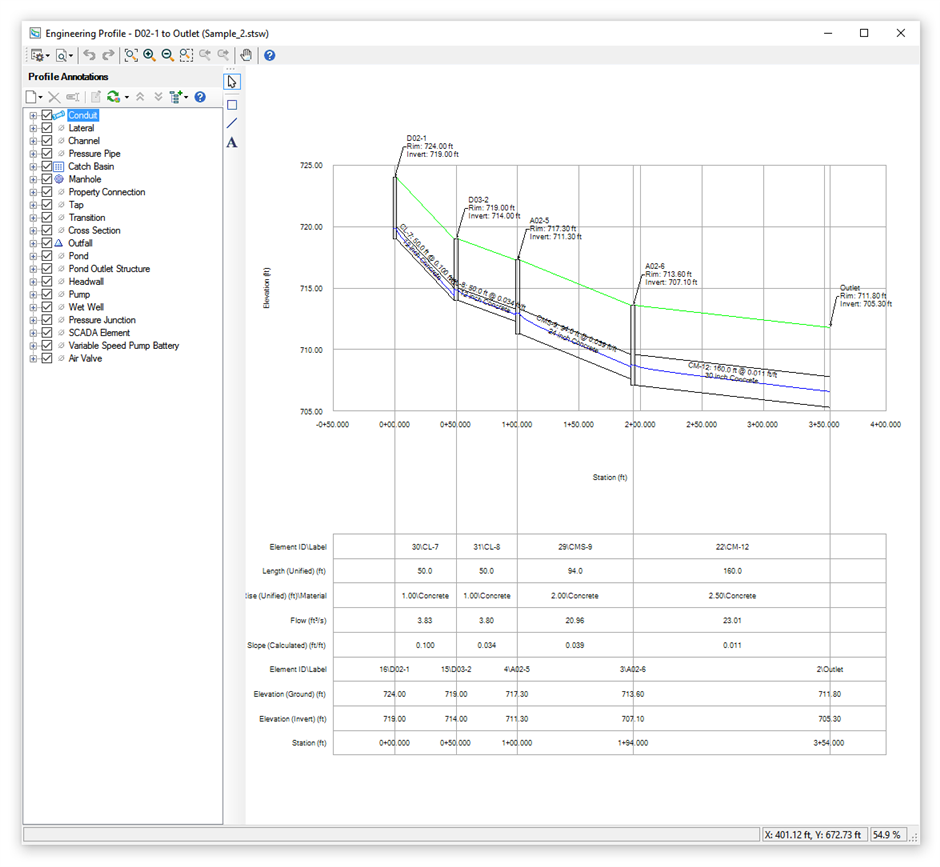
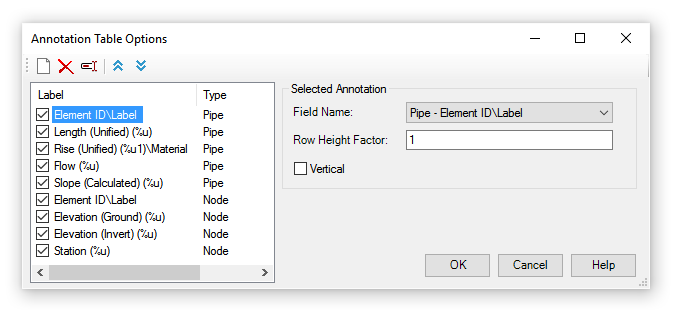
However, the displayed fields and field order can be edited in the engineering profile which makes it more customizable.
To toggle the annotation table display, click on the down arrow next to the Chart Settings icon and select "Show Profile Annotation Table" from the dropdown menu.
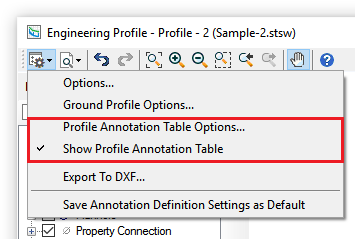
The annotation table options can be edited by selecting "Profile Annotation Table Options…" from this dropdown menu.
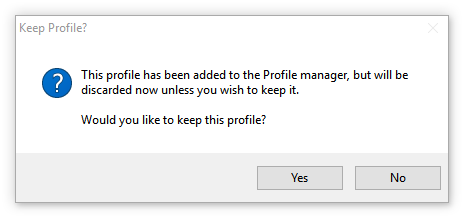
Profiles no longer save automatically
Profiles created with the context menu (right-click>Create Profile) are now temporary. When you close the profile viewer for a temporary profile, you are asked if you want to save it. When you select Yes to this prompt you will have the chance to enter a label for the profile.
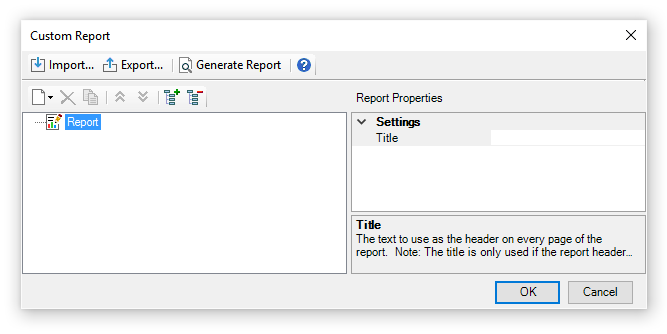
Customizable Reports
A new Custom Report tool has been added to the Report tab. This tool allows you to quickly assemble a customized report which can contain user input, results, graphs, etc. You can now define the template interactively instead of modifying an XML file manually (which can still be done).
The reports can be exported to the following formats
- PDF
- HTML
- MHT
- RTF
- Excel
- CSV
- Text
- Image
The Report Options dialog can be accessed by clicking the icon below the Custom Report icon. This dialog allows you to control how reports are displayed (eg. font, header, footer, margins).

See:
- Help "Custom Reports"
- Help "Report Options"
Usability Enhancements [Top of Page]
Duplicate Prototypes
The Prototypes Manager now includes the option to duplicate prototypes.

Open on selection from within FlexTable
When you have a FlexTable open, i.e. Junction FlexTable, you can now select the rows in the table based on the current selection.

To use the feature:
- Select some elements.
- Open a FlexTable for one of the selected elements and click the drop-down arrow for the “Select in Drawing” button.
- Click the last item, “Select from Drawing”.
- If there are any elements for the type of table you currently have open, it will select the rows for the elements selected.
- You can then filter down the contents of the table by right-clicking the row header and clicking on “Open on Selection”.
Double-click on dropdown list to toggle through values
When editing data in the property grid you can double-click the label to change the value. This applies to Boolean fields (those that show true/false values); reference fields (i.e. zone); and enumerated fields (i.e. Status (Initial)). When you double-click any of these field types it will cycle through the available values in the drop-down list. Commands like “Edit” for reference fields are excluded during the cycling.
Option to auto-close the Calculation Summary dialog after computing a model
The Calculation Executive Summary dialog box opens after you compute a model. You now have the option to not automatically open the dialog after a compute by unchecking “Show this dialog after Compute”. This option applies to all available solvers for the product. This is a global option and once unchecked applies to all projects opened in the product.
The post-calculation summary dialog now allows you to choose if it displays after computing a model as seen in the image below.

This dialog can also be accessed by clicking on the Home tab and selecting the Calculation Summary icon.

New alternative features (recently added to FlexTables)
Some features that were recently added to FlexTables are now available for alternatives. You can now quickly zoom to an element within an Alternative dialog by either right-clicking on the row header and selecting "Zoom To", or by double-clicking on the row header. When a row is highlighted, pressing enter will select the next row.
Excel export option available in all platforms
FlexTables can be exported to an Excel file in multiple products (SewerGEMS, SewerCAD, StormCAD, and CivilStorm) and for all integrated platforms (MicroStation, AutoCAD, ArcMap, and stand alone).
See: Can I easily export my results to an Excel spreadsheet?
Inroads IDF Importer
InRoads IDF files can now be imported into an engineering library storm event group which can then be used by SewerGEMS, StormCAD, CivilStorm, or PondPack. This can be done as a batch process with an external tool or individually using the Storm Data dialog.
CONNECT Integration
This release requires the latest version of CONNECTION client. If it isn't already on the computer, it will be downloaded and installed during the product's installation.
After the product installation completes, a CONNECTION client slideshow will display. This provides an introduction to the CONNECTION client, allows you to enter your login information, or create a new account if you don't already have one.
There is a new CONNECTED Project association dialog which allows the default behavior to be set. If you don't want the dialog to appear in the future, then select "Do not notify me again".

View Changes
The view can be quickly set to Zoom Extents by double-clicking the middle button on your mouse. For some, this may be done with the scroll-wheel button.
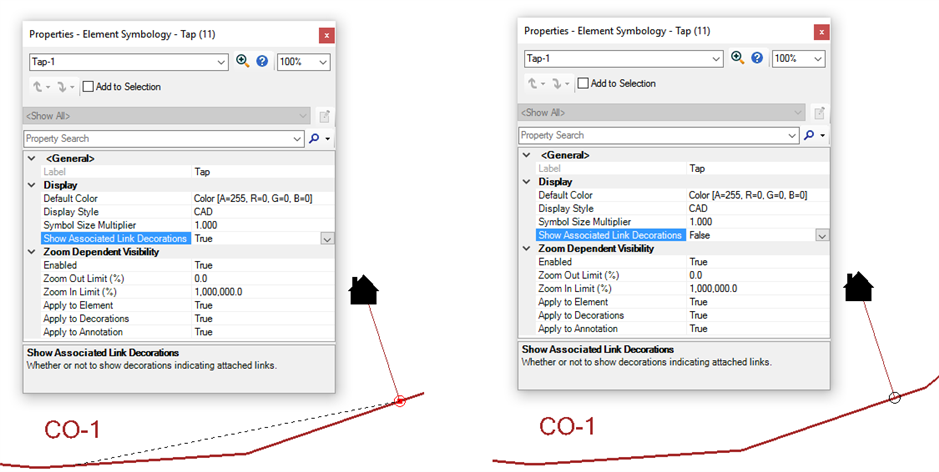
Toggle tap node dashed line display
When a tap is placed, a dashed line appears to show which link the tap is associated with. The tap element symbology properties now include a "Show Associated Link Decorations" field to control if this dashed line is displayed.
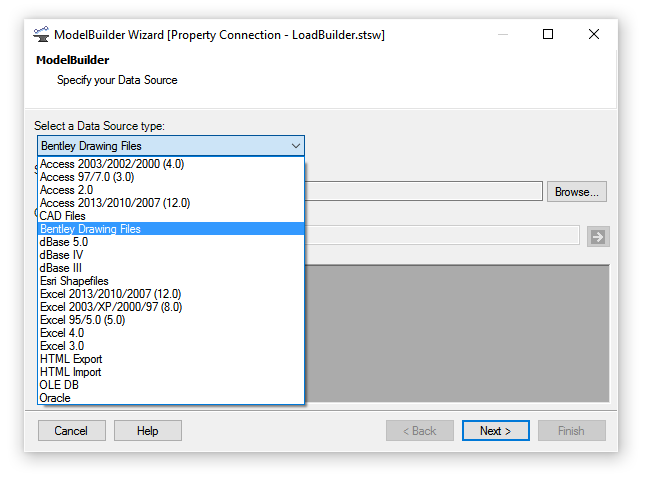
Added support for DGN files in ModelBuilder
ModelBuilder now supports Bentley Drawing File formats (*.idgndb, *.imodel, *.dgn).
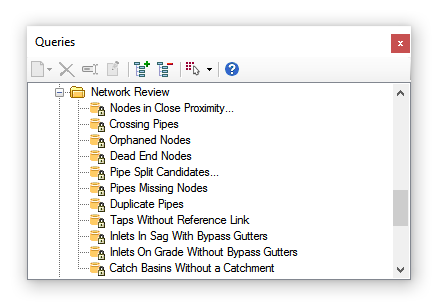
New Queries
The following Queries have been added.
Network Review
- Inlets In Sag With Bypass Gutters
- Inlets On Grade Without Bypass Gutters
- Catch Basins Without a Catchment
Network Trace
- Find Adjacent Nodes
- Find Adjacent Links
- Find Adjacent Start Nodes
- Find Adjacent Stop Nodes

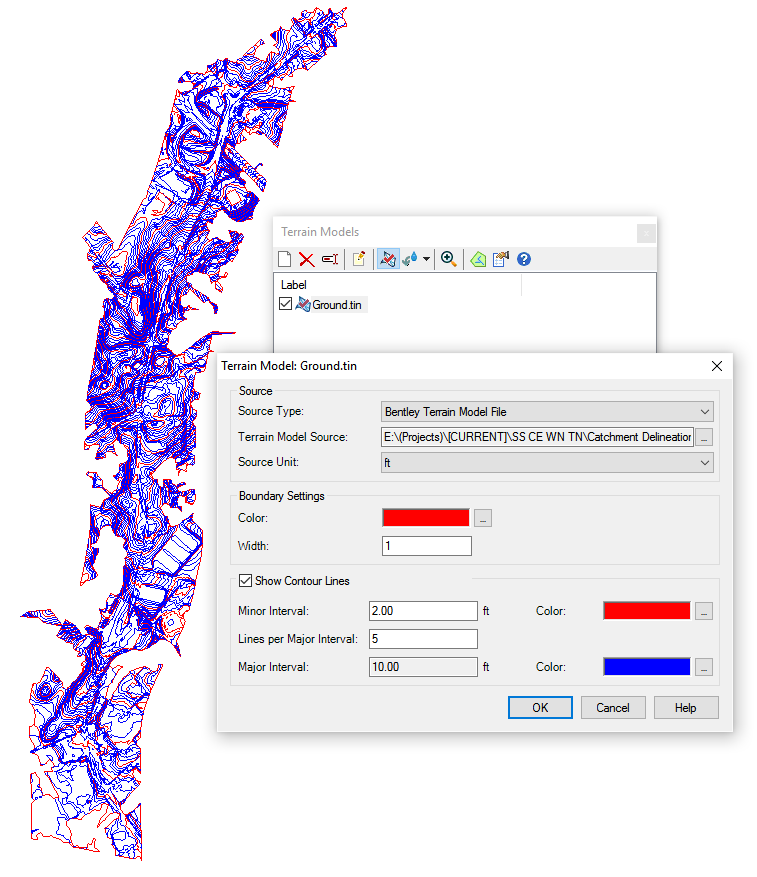
Display contour lines in plan view
Terrain Models can now display contour lines. The terrain model edit dialog allows you to define the minor interval and the amount of lines per major interval. The major interval will be calculated based off of those inputs. You can also customize the colors of the major and minor interval contour lines.
StormCAD TechNotes and FAQs
Ribbon Interface for the Storm and Sewer CONNECT Edition Products
Product TechNotes and FAQs
OpenFlows Methods Product TechNotes And FAQs
SewerGEMS and CivilStorm TechNotes and FAQs
Downloading OpenFlows / Hydraulics and Hydrology Software
Software installation order
Cumulative patch set information
Set up notifications for new versions and patch set releases

| |
Original Author: |
Craig Calvin |
|