| |
Product(s): |
SewerGEMS, SewerCAD |
|
| |
Version(s): |
V8i, CONNECT Edition |
|
| |
Area: |
Output and Reporting |
|
Problem
When graphing the HGL or level of a wetwell along with the flow in downstream pumps, the results are not expected. For example the wetwell level appears to drop during times when the pump appears to be off.
Or, when graphing one of the "Maximum" statistics such as Overflow (Maximum) alongside the corresponding calculated result (such as Overflow), the calculated result never rises up to meet the maximum
Solution
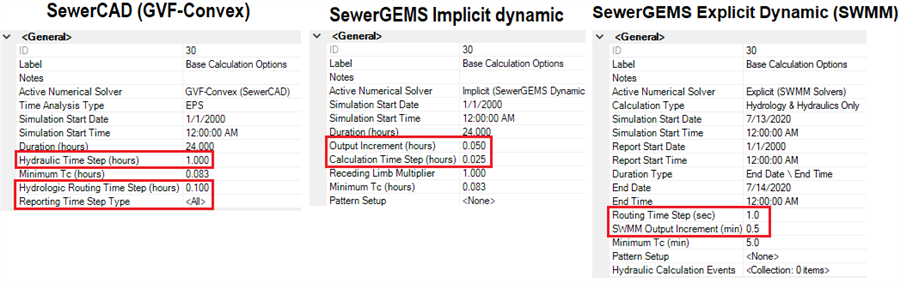
This may be due to the granularity of the results output. If the output timestep is too large, you may be missing important details between the reporting steps. For example a pump may be cycling on between the reporting timesteps, so the graph appears as if the pump is off. To resolve this, ensure that your output increment (reporting time step) is small enough to capture these changes. A quick way to do this is to set it equal to the calculation timestep.
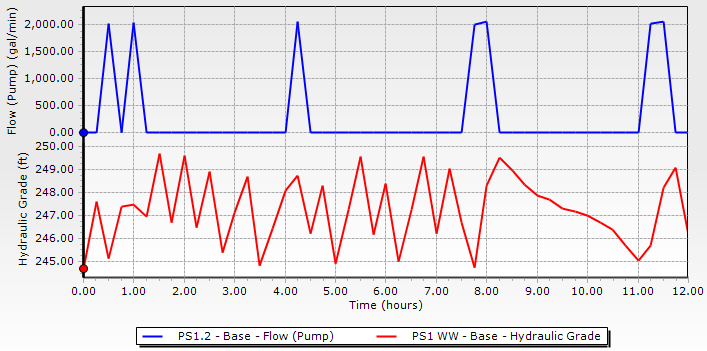
For example here is a case where the calculation timestep is 0.001 hours but the Output Increment is 0.25 hours:
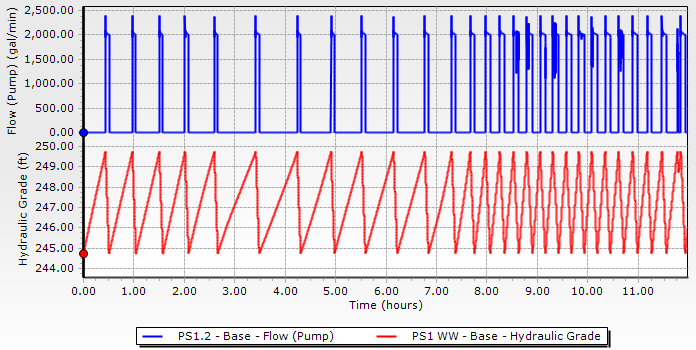
Here are the results when both are set to 0.001 hours:
Note: unexpected results with pumps could also be due to instability. Review the first two articles below for assistance with that.
See Also
Troubleshooting unstable SewerGEMS and CivilStorm results using the implicit solver
Troubleshooting unstable SewerGEMS and CivilStorm model results using the Explicit SWMM Solver
Wetwell continues to fill even though pump controls are configured
SewerCAD graph data table missing timesteps (hydraulic vs. hydrologic timestep)
Pump On/Off Elevations vs. Logical Controls