| Product(s): |
HAMMER |
| Version(s): |
V8 XM, V8i, CONNECT Edition |
| Area: |
Output and reporting |
Background
When performing a transient simulation in HAMMER, looking only at the minimum and maximum transient pressures (properties, flextables, color coding, etc) does not provide the complete picture of how those pressures occurred. In some cases you may be surprised by a particular result and without further details, you may wonder if that result is correct or how it could occur.
Animating the transient simulation in a profile path can be a much better way to visualize exactly what is happening during the transient event. This allows you to see how transient waves interact and reflect and the formation and collapse of vapor or air pockets.
Using Profile Animations
First, create profiles for your model, covering major pathways that you need to analyze. You may also want to add one or more shorter "detail" profiles, for analyzing what happens at a specific location. For example for a pump station, a "detail" profile could cover from the upstream source (typically a reservoir), through the pump, and the next pipe or two.
If the profile in the Transient Results Viewer does not cover all of the expected elements, select the profile in the profile manager, click the Highlight button, and ensure that all expected elements are covered. Click the Edit button in the profile manager, click "select in drawing" and add additional elements if needed.
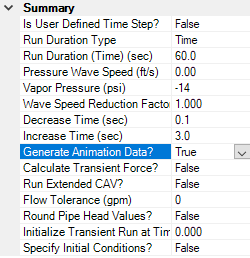
Then, in your transient solver Calculation Options, make sure you have selected "True" for "Generate Animation data":
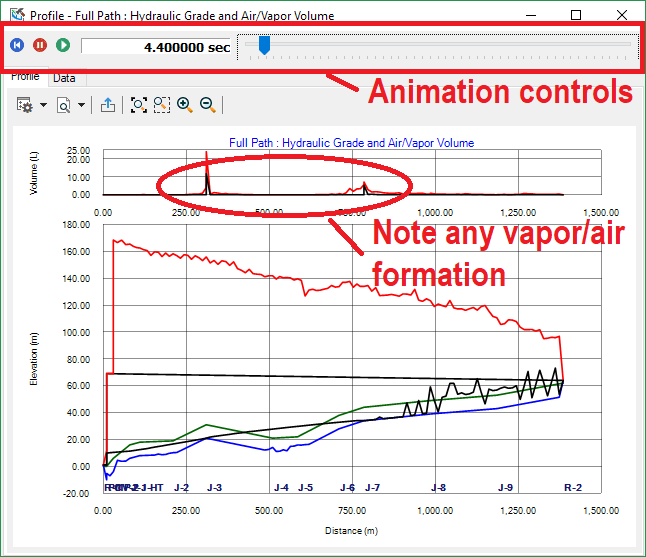
Next, after computing the transient simulation, open the Profile of "Hydraulic Grade and Air/Vapor Volume" for a profile covering the area of interest. Click the play button at the top or move the time bar to animate the transient simulation and get a better understanding of exactly what's happening. You may notice an air or vapor pocket forming (top graph) and later collapsing with subsequent severe surges forming, reflecting and interacting with each other.
To control the speed of the animation, click the Settings button in the upper-left corner (gear icon) and in the "General" tab, change the "Animation Frequency".
Note: to ensure finer granularity of results in the animation, consider the tips here: Recommended HAMMER Calculation Option Reporting Settings
Video Demonstration
See Also
What do the different colored lines in a Transient Results Viewer profile represent?
Surge mitigation for systems with intermediate high points experiencing negative pressure or spikes in pressure