| Product(s): |
SewerGEMS, SewerCAD, CivilStorm |
| Version(s): |
CONNECT Edition Update 1 and later |
| Area: |
Output & Reporting |
Introduction
This TechNote explains how to use the Critical Storm Analysis feature, to supplement the information in the related Help documentation topic.
The Critical Storm Analysis feature is available starting with the CONNECT Edition Update 1 version of the OpenFlows storm and sewer products. Note: Improvements were made to this tool starting with CONNECT Edition Update 3 (build 10.03.01.08), to make it easier to use and reduce the number of scenarios, alternatives, and calculations. The user workflow takes advantage of existing tools, like prototypes and the New Scenario wizard to decrease the time it takes to run the Critical Storm Analysis and the dramatically lower the number of scenarios created. The workflow below has details on this improved workflow. The workflow for older versions is included at the end of this wiki.
Background
Note: Some of this information is relevant to older versions, but the information below includes some items related only to CONNECT Edition Update 3.
The Critical Storm Analysis feature analyzes the results of the selected scenarios, to determine which scenario is the most critical one either by using the Hydraulic Grade Line at nodes, or the Flow in conduits. For each analysis type, you can choose whether to use the Maximum, Mean, or Median values for HGL or flow, depending on the method you choose.
It is important to note that the critical storm is unlikely to be the same for every element in the system. At the top of a system, a storm event with a shorter duration is likely to be critical, but working down the system, an event with a longer duration may become critical. If the system includes attenuation, such as a pond, then the critical storm event downstream of it may have a duration of days, as opposed to hours above the pond, or minutes at the top of the system.
Before running Critical Storm Analysis, you need to create and run all the scenarios that you want to evaluate. The analysis is based on time simulations, so scenarios that use the GVF-Rational and GVF-Convex (steady-state) solvers cannot be used. This means that Critical Storm Analysis is not available in StormCAD.
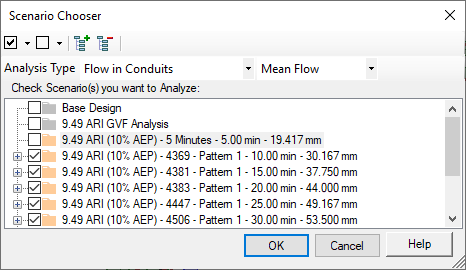
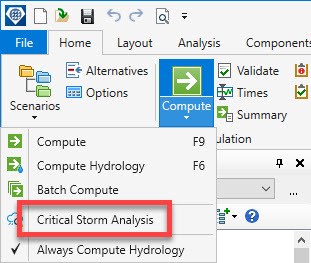
To access the Critical Storm Analysis tool, go to the Compute button on the Analysis ribbon. In the drop-down menu, click Critical Storm Analysis. Choose the Analysis Type, select the scenarios to analyze, and click OK.
Calculation of the Maximum/Mean/Median results
The selected scenarios are processed in a specific order- starting with the shortest return period, and the smallest storm duration within that return period, then progressing up to the longest storm duration within that return period, then moving on to the next smallest return period
Maximum (HGL or Flow)
The Maximum (HGL or Flow) result is the highest value which occurs in all the scenarios. It is found as follows:
1. Starting at the shortest duration in each return period, find the maximum of the Hydraulic Grade Line(Out) or Flow values.
2. Compare the Hydraulic Grade Line (Out) or Flow values found in the other durations and return periods, to see if they are higher.
3. The scenario that causes the highest result of all is deemed to be the critical scenario.
If more than one scenario has the same Hydraulic Grade Line (Out) value, then the scenario with the largest volume of overflow is deemed to be the critical one.
Mean and Median (HGL or Flow) results
The Mean and Median (HGL or Flow) results are found as follows:
1. For each duration in a return period, find the median or mean from the HGL or Flow values.
2. Find the scenario which gives the HGL or Flow that is closest to the median or mean HGL or Flow found in step 1. This is the critical scenario for that duration.
3. Repeat steps 1 and 2 for all the durations in that return period.
4. Find the highest of the HGL or Flow values identified in step 3. This is the critical scenario for all of the durations in a return period.
5. Repeat steps 1 to 4 for all return periods, to identify the critical scenario.
Hydraulic Grade Line at Nodes analysis type
This analysis type uses the valid nodes to calculate the critical scenario. The valid types of node are manholes, catch basins, or outfalls. Other node types, such as a headwall for example, are not considered because they do not have a Hydraulic Grade Line (Out) value. Any inactive nodes for a scenario are ignored.
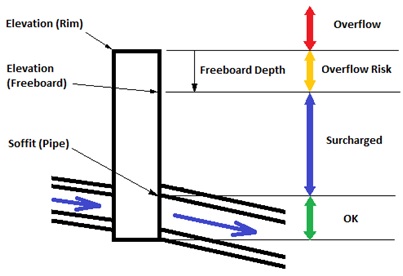
The Critical Storm Analysis determines the worst status for each node over the course of all the scenarios. The status for a node can be one of four values: OK, Surcharged, Overflow Risk, and Overflow.
The status of each node is directly related to the Hydraulic Grade Line (Out) value. To determine the status, the following conditions are checked for each selected scenario: • If the maximum hydraulic grade is less than the downstream pipe's soffit (inside top of pipe), the status is "OK".
• If the maximum hydraulic grade is greater than the downstream pipe's soffit, but less than the node's rim elevation minus the node's freeboard depth, the status is "Surcharged"
• If the maximum hydraulic grade is greater than the node's rim elevation minus the node's freeboard depth, but less than the rim elevation, the status is "Overflow Risk"
• If the maximum hydraulic grade is greater than the rim elevation, the status is "Overflow"
The scenario with the worst status is shown as the critical scenario for that node.
Notes:
• If the status for a node is determined as "OK", then the first scenario with that status is shown as the critical scenario.
• The default freeboard depth for the node is 1 foot (304.8 mm).
• The soffit is determined by adding the Rise (Unified) of the downstream pipe to its upstream invert. If the downstream pipe is set to use the invert of the upstream node, the invert will be the node's invert elevation. The information is used for the scenario being analyzed from its assigned physical alternative.
Flow in Conduits analysis type
This analysis type uses conduits to calculate the critical scenario. All types of conduit - closed sections, open sections, and culverts - are included. Any inactive conduits for a scenario are ignored.
The critical scenario is determined by analyzing the Flow values, as described above. The status of each conduit is not directly related to the flow - the flow determines the critical scenario, and the status provides an indication of how the conduit is operating.
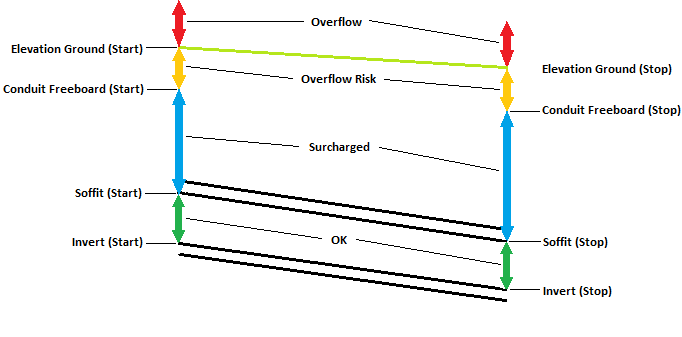
The status for a conduit can be one of four values: OK ,Surcharged, Overflow Risk, and Overflow. To determine the status, the following conditions are checked for each selected scenario:
• If the HGL (In) is less than the Soffit (Start) and the HGL (Out) is less than the Soffit (Stop), the status is "OK"
• If the HGL (In) is greater than the Soffit (Start), but less than the Conduit Freeboard (Start),and the HGL (Out) is greater than the Soffit (Stop), but less than the Conduit Freeboard (Stop), the status is "Surcharged"
• If the HGL (In) is greater than the Conduit Freeboard (Start), but less than the Elevation Ground(Start) and the HGL (Out) is greater than the Conduit Freeboard (Stop), but less than the Elevation Ground (Stop), the status is "Overflow Risk"
• If the HGL (In) is greater than the Elevation Ground (Start) and the HGL (Out) is greater than the Elevation Ground (Stop), the status is "Overflow"
Notes:
- The soffit start and stop elevations are calculated by adding the Rise of the conduit to the start and stop invert elevations.
- The Conduit Freeboard elevations are calculated by deducting the Conduit Freeboard value, which is set in Options, from the Ground Elevation. The Freeboard values from the connected nodes are not used, because not all node types have it.
- If the status at one end of the conduit is different to the other, then the higher status is used. For example, if the status at the start is Surcharged, and at the stop is Overflow Risk, then Overflow Risk is used.
- There is a known issue (reference # 392880) with versions 10.03.01.08 and earlier where the program may crash when trying to use this feature. If you encounter this problem, either upgrade to a newer version if available, or upgrade to at least 10.03.01.08 (your version number can be found under File > Help > About) and contact Technical Support regarding the patch. There is another known issue in version 10.04.00.158 which can cause a different crash (reference # 1186064). A resolution should be in a future version, when available. In the meantime, a workaround is to use batch compute to compute each scenario separately, then use color coding and/or flextables to view results separately (such as maximum HGL).
Critical Storm Analysis Wizard
The Critical Storm Analysis Wizard was added in CONNECT Edition Update 3. It assists in streamlining the process of creating scenarios, alternatives, calculation options and storm events for a specific set of return periods and durations. It provides an easy method to run a series of unsteady state calculations on an initial design. For example, you may have created a conveyance system using steady state (or peak flow)calculations, and perhaps ensured that there is no surcharging for the design storm. The next step might be to see how that system copes with a range of storm events and durations, and this wizard will guide you through this process.
The set of scenarios, alternatives, and storm events are created virtually and then calculated. After each virtual scenario is calculated the results are retrieved and cached. Once all virtual scenarios are calculated ,the results are used with the Critical Storm Analysis tool.
The base scenario is used as the parent of any scenarios exported from the critical storm summary results table. It is also used to initialize the default assignment for the catchment prototype and calculation options. This is done if the base scenario is a non-rational method-based scenario. The calculation options must use the implicit, explicit or GVF-Convex (using EPS) solver. The active catchment prototype must use a non-rational method-based runoff method.
The critical storm analysis wizard uses catchment prototypes to apply non-Rational runoff data to catchments in your model. The catchment prototype may be left unassigned if the base scenario already uses non-rational method catchment settings.
Other properties used in the Critical Storm Analysis Wizard are return periods, storm events, storm duration, and climate change factors.
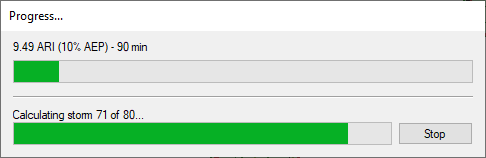
Once the profiles are set and the finish button is clicked, the virtual scenarios are calculated. After each calculation, the results are retrieved and cached. A status bar will show the status of the calculation. The lower bar is the overall status and shows the current virtual storm out of the total number of storms. The top progress is used when there is a set of temporal patterns per storm.
You can stop the calculation at any time. The results stored up to the point when you clicked Stop will be used with the Critical Storm Analysis tool. If a virtual scenario fails to calculate, you are prompted to export the problem scenario for further review. Clicking Yes will create the scenario, necessary alternatives, and the storm data. You can then compute that individual scenario and review the resulting user notifications to determine the cause of the problem.
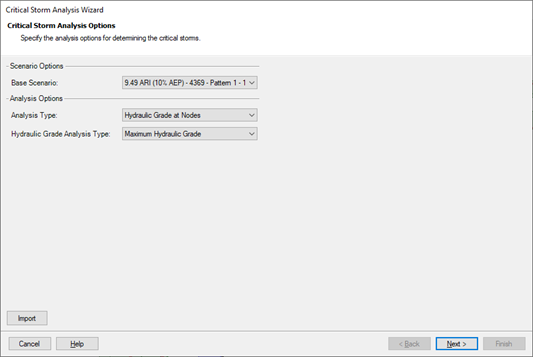
In the first step on the Critical Storm Analysis Wizard, you will select the Base Scenario, the Analysis Type (HGL or Flow), and whether you are choosing the Maximum, Mean, or Median values.
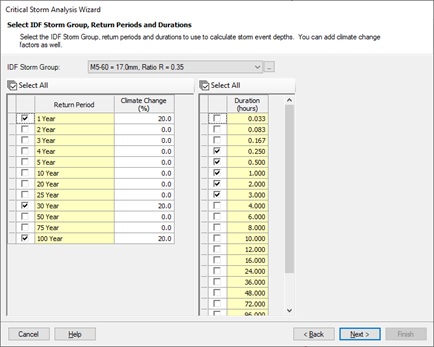
In the next step, you will select the IDF Storm Group to use to convert intensities into depths. An IDF Storm Group is defined as a storm event group that creates IDF curves. If there are IDF Storm Groups are not listed, use the […] button to the right of the drop-down to open the storm data dialog. In this dialog you can add new IDFStorm Groups. When an IDF Storm group is selected, the return periods and durations are populated in the return period and duration lists. At least one return period and duration selection is required to click Next and move to Step 3.
The climate change factors are an option that adds a percentage to the base depth of the storm event. This allows you to design your system with climate change in mind. Only percentages of greater than 0% are used.
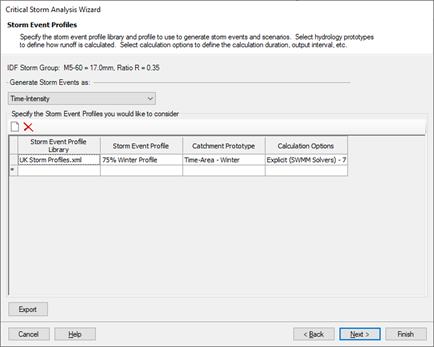
The next step will depend on the type of IDF storm you select. The following is the workflow if you are using anything but the "Australia Rainfall and Runoff (2016)." After selecting the IDF storm, you would choose to use either Time-Intensity or Time-Depth.
In the provided table, select the storm event library and corresponding dimensionless rainfall curve. A catchment prototype and calculation option are also required for each row. Only catchment prototypes that use non-Rational based runoff methods are available for selection. Only calculation options that use the implicit, explicit or GVF-Convex (using EPS) solvers are available for selection. The table provides you the choice of any type of storm event profile – this can be either a fixed-time storm event profile or a dimensionless storm event profile.
If there are no storm event profiles available, click the […] button on the right side of the cell for storm event profile library or storm event profile. This will open the Engineering Libraries dialog. From here, you have limited editing abilities. You can add an existing engineering library. To create and populate a new library, use the Engineering Libraries command in the ribbon.
If you selected a base scenario that uses a non-rational based runoff method, then you can optionally leave the catchment prototype unassigned. This will use the existing catchment properties during the calculation. However, if the base scenario is rational method based (Rational Method, Rational Method(UK), Modified Rational) then assigning a catchment prototype is required.
Calculation options also need to be selected. Only calculation options that use the Implicit, Explicit, or GVF-Convex (using EPS) solvers will be available for selection. This allows you completely customize the calculation options on how each profile is calculated.
At this point you can optionally click on Finish which will immediately start the calculations or click on Next to review the profiles that will be used for the calculations. The export button allows you to export the settings of the wizard to an external file for use later. This can make the process of configuring the wizard a lot quicker like presetting the selection of return periods and durations to use. You can export to ProjectWise as well as the local data storage.
If you are using the Australia Rainfall and Runoff (2016) workflow, the list of available libraries will contain fixed-time dimensionless curves. Once a storm event profile library is selected, the storm event profile column becomes editable and you can specify the type of storm event to generate (Time-Intensity or Time-Depth). From there, the workflow is similar to other IDF storms.
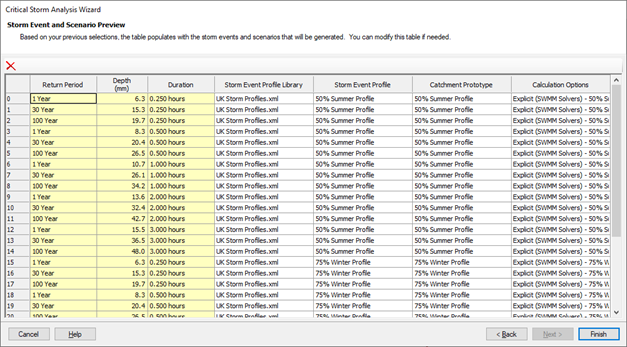
In the next step, you will have a table showing the profiles that will be calculated. You can edit the data in the storm event profile library, storm event profile, catchment prototype, and calculation option columns. Filtering, sorting, and the global edit feature are all supported. You can also remove rows by using the delete toolbar button or highlighting the row and hitting the delete button on the keyboard.
For Australia Rainfall and Runoff (2016) Rainfall Data, the table will show a row for each return period/duration pair. Typically, the same number of rows on the previous page’s table will be shown in this table as well.
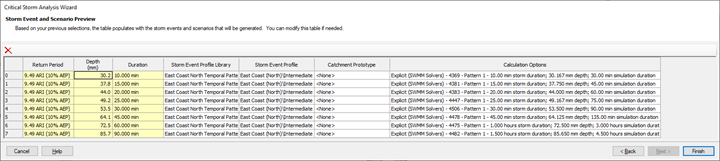
For all other rainfall data, the preview table will show each individual profile that will be calculated.
In the final step, you will have a table of all the virtual scenarios created during the calculation. These scenarios do not yet exist. If you want to do further analysis on the performance of any of the virtual scenarios, you can export them as scenarios. The critical scenarios are automatically checked by default. You can turn on or off any scenario for export. You can also global edit the “Export?” column as well.
The option “Compute Exported Scenarios” is checked by default. Once all the checked scenarios are created, along with appropriate alternatives and storm data, they are automatically calculated if this option is checked. The label of the parent scenario for the exported scenarios is shown above the table.
Scenario Chooser
The Scenario Chooser dialog allows you to select the type of analysis to use to identify the critical scenario, and the scenarios to be analyzed, with the Critical Storm Scenario Wizard. You can access this by going to Home > Compute > Critical Storm Analysis. The Scenario Chooser dialog displays all the scenarios in the model, in their hierarchical form. Each scenario is associated with a checkbox - check the box to select the scenario.
Not all scenarios are valid, and this is for one of these reasons:
• Scenarios with the disabledscenario icon do not have results. These scenarios are greyed out, and cannotbe checked.
• Scenarios with a small redx in the corner do not use an appropriate solver (they use either GVF-Rational,or GVF-Convex using steady-state analysis) and cannot be checked.
Valid scenarios, therefore, are those which have results and use the Implicit, Explicit, or GVF-Convex (using EPS) solvers.
Critical Storm Analysis Results Table
Once the critical storm analysis is complete, this table displays the results of the analysis.
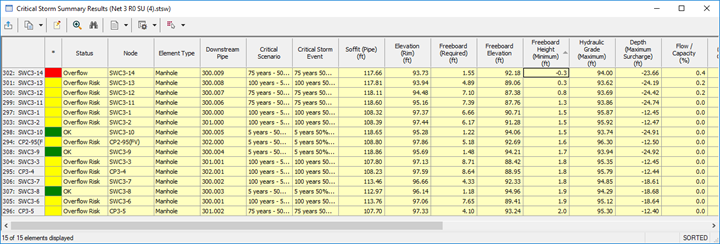
On the right-click context menu of any column, you can use "Dendritic Sort (Upstream -> Downstream)". This is the same sort option found in FlexTables. There are several available columns in the table. These vary slightly, depending on the Analysis Type selected. By default, all columns are available in the table. You can modify which columns are included by using the Edit button in the toolbar.
The * column shows the status of the node or conduit using a color coding. There is also a Status column reporting if it is OK, Surcharged, Overflow Risk, or Overflow. Additional numerical results are also available int the table.
Configuring a Critical Storm Analysis in CONNECT Edition Update 2 and Update 1
The Critical Storm Analysis feature analyzes the results of the selected scenarios to determine which scenario is the most "critical" for each selected node. This type of analysis is common in some particular regions. The node element represents a manhole or a catch basin. The critical scenario is the one with the highest Hydraulic Grade Line (Maximum) value. If more than one scenario has the same Hydraulic Grade Line (Maximum) value, then the scenario with the largest volume of overflow is the critical one.
Critical Storm Analysis is an efficient tool to determine the most critical storm which is subjected to a storm-sewer system. Whenever a system is designed, it is optimized so that it can successfully convey the runoff from multiple storms occurring for different durations and intensities. The Critical Storm Analysis feature shows the capability of the system to sustain multiple storm events without surcharging, overflowing or flooding.
The Critical Storm Analysis tool allows you to understand the adequacy of the system for different cases represented as scenarios. With this tool the user can find out the flooding / overflowing of manholes for a scenario and any mitigation measures / design changes that need to be undertaken to resolve these issues. Also, the designer can check for the design adequacy based on the allowable limits for which the system can be designed based on the status messages appearing for critical storm analysis.
Before running the critical storm analysis, the user must create and run all the scenarios that will be evaluated in the analysis. The analysis is based on time simulations so that GVF-Rational and GVF-Convex (Steady State) solvers cannot be used. However, the Implicit, Explicit (SWMM), and GVF-Convex (EPS) solvers are valid for this analysis.
The hydraulic grade for the node is analyzed for all selected scenarios in the Critical Storm Analysis feature. The Critical Storm Analysis determines the worst status for each node over the course of all the scenarios. The status for a node can be any one of four (4) values: OK, Surcharged, Overflow Risk, and Overflow depending on the hydraulics of the system. To determine the status of a node, the following conditions are checked for in each selected scenario;
• “OK” = the maximum hydraulic grade is less than the downstream pipe's soffit (inside top of pipe)
• “Surcharged” = the maximum hydraulic grade is greater than the downstream pipe's soffit, but less than the node's rim elevation minus the node's freeboard depth.
• “Overflow Risk” = the maximum hydraulic grade is greater than the node's rim elevation minus the node's freeboard depth, but less than the rim elevation.
• “Overflow” = the maximum hydraulic grade is greater than the rim elevation.

The status index ranges from “OK” to “Overflow”. The severity of the status is as follows,
OK < Surcharged < Overflow Risk < Overflow
The scenario for which a node has the worst status, i.e. most severe is the critical scenario for that node.
The Critical Storm Analysis feature can be found in the Calculation tab under the Home tab. When the dropdown menu under Compute is accessed, Critical Storm Analysis feature is available.
As an example, we will work with a simple storm-sewer model consisting of a base scenario as “2 YR” storm and two child scenarios as “10 YR” and “25 YR” storm events. When the Critical Storm Analysis feature is selected the “Scenario Chooser” will show up like this;

Not all scenarios may be valid, for reasons including:
• Scenarios with the disabled scenario icon do not have results. These scenarios are grayed out, and cannot be checked.
• Scenarios with a small red “x” in the corner do not use an appropriate solver (they use either GVF-Rational, or GVF-Convex using steady-state analysis) and cannot be checked.
Valid scenarios, therefore, are those which:
• Have results.
• Use the Implicit, Explicit or the GVF-Convex (using EPS) solvers.
There are four buttons in the toolbar at the top of the dialog. These are the “check” and “uncheck” options for choosing the scenarios and the expansion and collapse of the hierarchy trees.
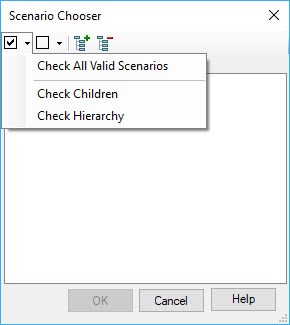
The “Check All Valid Scenarios” option must be selected when the User wishes to compare all scenarios which have the Implicit or Explicit-SWMM engines as their numerical solvers. This feature is useful when you have multiple scenarios using different solvers. As pointed out earlier in this tech-note; the Critical Storm Analysis works on the principle of time simulations and hence scenarios using the GVF-Convex and GVF-Rational engines won’t be considered for analysis.
The “Check Children” option selects only the child scenarios of your base scenario. If you have more than one base scenario, then the child scenarios of the highlighted base scenario will be selected. For example, if the highlighted base scenario is “2 YR” then the child scenarios for that particular base scenario will be chosen i.e. “10 YR” and “25 YR”.

The “Check Hierarchy” option selects the currently highlighted scenario and its entire hierarchy. So, as shown in the case above, all the scenarios including base would be selected for comparison.
The “Uncheck” option similarly has sub-options such as “Uncheck All Valid Scenarios”, “Uncheck Children” and “Uncheck Hierarchy” which perform the opposite action to the checking sub-options. So, the user can quickly uncheck the scenario which should not be considered for a Critical Storm Analysis.
Performing a Critical Storm Analysis
Once the scenarios required for analysis are selected, the Critical Storm Analysis for them is performed and the results are displayed in a tabular format. For our example, we have considered the “2 YR”, “10 YR” and “25 YR” scenarios for analysis.
If a particular node is selected in the drawing pane prior to analysis, the critical storm analysis would be performed for that node only. If nothing is selected, the nodes in the entire model are considered.
The results would appear in a tabular format like this;
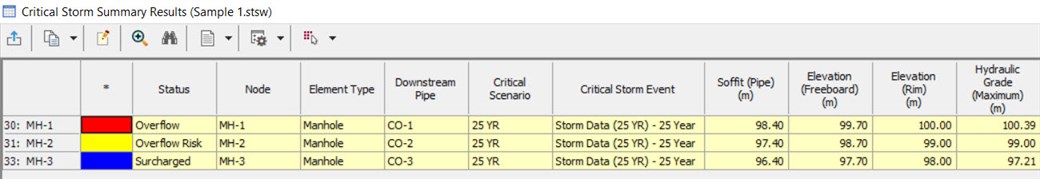
The above table shows that out of the three scenarios selected for analysis, the scenario “25 YR” is the critical scenario for all the nodes in the system. This is a simplified example though, since the 25-year event likely has more runoff than the 2 and 10. In other situations, you may have a range of durations, return frequencies and possibly other runoff parameters.
MH-1 is showing an Overflow Status i.e. the hydraulic grade at this node for the 25-year storm event is above the rim elevation. The manhole can be termed as “Overflowing."
MH-2 is showing an “Overflow Risk” Status, i.e. the hydraulic grade at this node for the 25-year storm event is below the rim elevation, but is greater than the rim elevation minus the freeboard depth. The manhole can be termed as “Overflow Risk.”
MH-3 is showing a “Surcharged” Status i.e. the hydraulic grade at this node for the 25-year storm event is below the rim elevation, but is greater than the downstream pipe’s soffit. The manhole can be termed as “Surcharged.”
In the model one can check which of the nodes are surcharged or overflowing by selecting the properties of “Is Surcharged?” or “Is Overflowing?” for annotation under Element Symbology. This article explains the difference between these two properties in detail.
Starting the the CONNECT Edition Update 2 release of the storm-sewer products, a new “Freeboard (Required)” field is included to allow you to help determine the lower limit of the overflow risk status when you are running a Critical Storm Analysis. The default value for this is listed as 1.0, but the user can input another value. The Critical Storm Analysis will determine overflow risk.
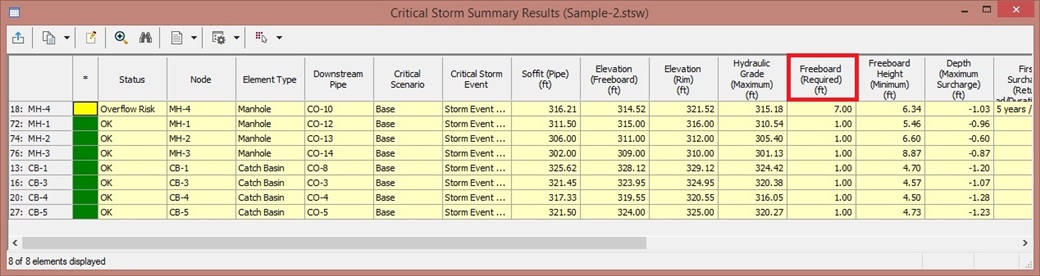
Note: The “Freeboard (Required)” field in only used for Critical Storm Analysis, and not used during the hydraulic analysis.
In the left-most column (labeled with an asterisk) the color associated with the “Status” is displayed. Here are the colors and the status associated with them;

The user can change the colors as required. The option to change the color coding system is available in the Critical Storm Status Options under the Option button available in the Critical Storm Summary Results.
Note: For the rest of the options available in the Critical Storm Summary Results and details of the result columns please refer the Help document for details (Calculating your Model > Critical Storm Analysis).
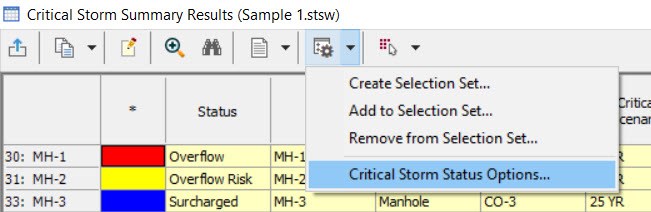
The user can change the color associated with a status by simply clicking on the ellipsis button next to the color in the Critical Storm Status Options dialog box. Different options are available for choosing the desired color.
Starting with the CONNECT Edition Update 2 release, you can now sort the rows of elements in the Critical Storm Analysis tool dendritically. This way selected rows are arranged not only by their upstream to downstream connectivity but also grouped by branch. Links of a dendritic stormwater network can be well-labeled with the Branch Labeling tool, resulting in a clear designation of links organized into tributary branches. After this sort, the first rows appearing will be the elements within the upstream most branch, and appearing in upstream to downstream order within that branch.
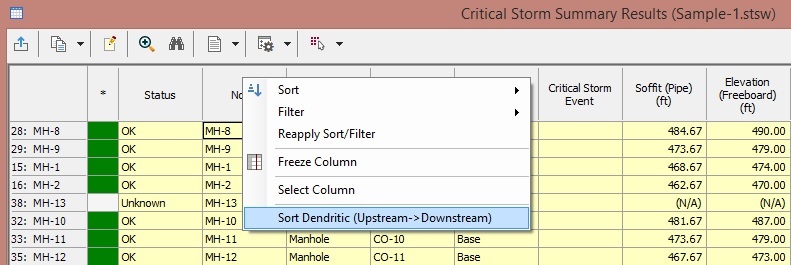
This will allow you to better see the impact of the critical storm analysis as you move downstream through your system.
Troubleshooting
When trying to compute one or more scenarios using this tool, the program crashes with a "stopped working" error
This is a known issue (Defect #1062070) that has been resolved with a patch for version 10.02.02.04. Either contract Technical Support for the latest cumulative patch set, or upgrade to a newer version when available (which will include the fix).
See Also
Difference between a "surcharged" and an "overflowing" node