| Product(s): |
SewerGEMS, SewerCAD, StormCAD, CivilStorm |
| Version(s): |
V8i, CONNECT Edition |
| Area: |
Output and Reporting |
Problem
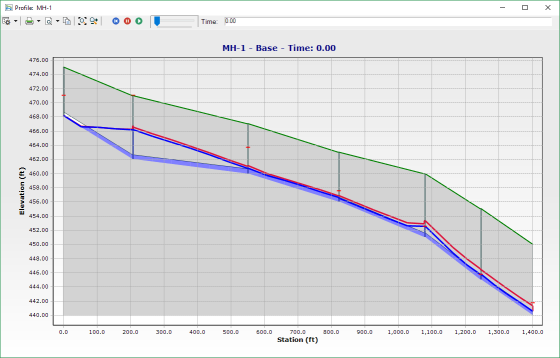
Profiles display a red 'tick' mark at the structures to indicate the maximum hydraulic grade over the course of the simulation. Is it possible to display this as a line, so as to visualize the max HGL 'envelope'?
Solution
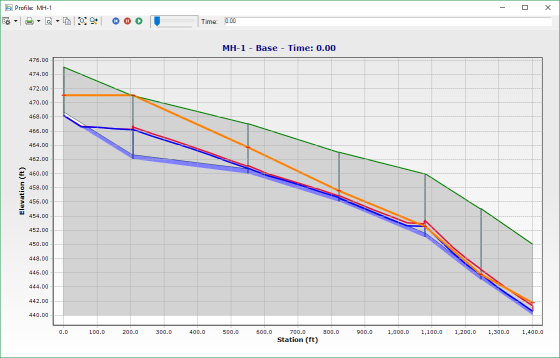
A maximum HGL 'envelope' can be seen in profile view by making the corresponding line series opaque in the Chart Options. This will cause the profile to display a line between the marks. The minimum of such envelope would be the starting water surface elevation, or pipe inverts.
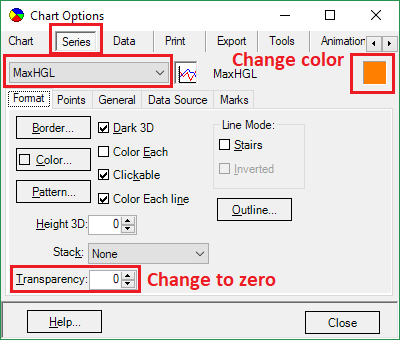
1) Open the profile, click the Chart Settings button in the upper-left corner and choose "Chart Options"
2) Click the "Series" tab at the top row of tabs, then select "Max HGL" from the dropdown list
3) Set the "transparency" to zero
4) Click the colored box in the upper-right corner and change the color (the default red color will otherwise be the same as the EGL line)
5) Click the Close button
Note:
- This line will not capture change in HGL that occurs along the length of conduit.
- If you close and reopen the profile, you will need to make the changes again.
- This only applies to the "standard" profiles seen when double clicking an entry in the Profile Manager.
- If you need more control over the max HGL line, or if you want to do this with Engineering Profiles, consider exporting to DXF and manipulating in AutoCAD (see link below)
Before:
After:
See Also
Exporting profiles to .DXF files