| Product(s): |
WaterGEMS, WaterCAD |
| Version(s): |
CONNECT Edition Update 2 and higher |
| Area: |
Modeling |
Problem
How does the Pump Performance Study feature work? How can I analyze pump performance?
Video
Solution
The Pump Performance Study feature was introduced with the CONNECT Edition Update 2 release of WaterGEMS and WaterCAD (build 10.02.00.43). Performance studies offers an efficient way of comparing the pump head and efficiency curves stored in a model with the SCADA data. This can help you identify which pumps may be running inefficiently and let you identify areas of concern. After completing a Performance Study, you will see tabular and graphical results. You can also graph the system head curve for the pump that you are checking.
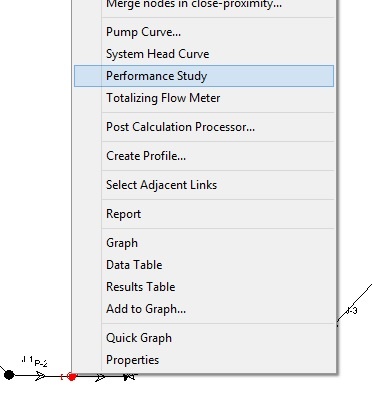
You can access this by right-clicking on a pump and choosing Performance Study.
After starting the pump performance study, the user will see the dialog below, which identifies the source of the data imported through a SCADA Signal. The performance study requires configured SCADA signals to retrieve data from the SCADA system. Note: Only historical SCADA data is supported.
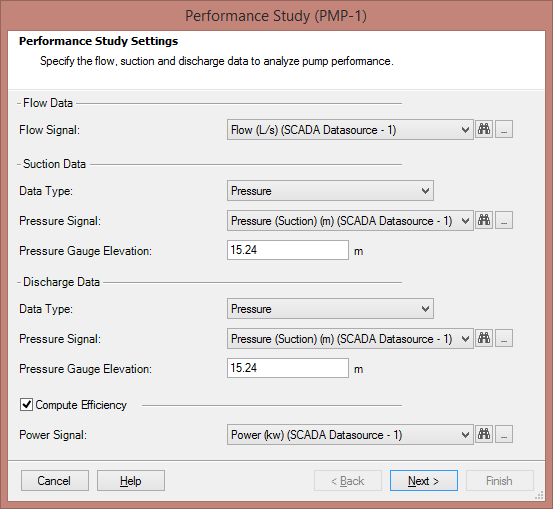
If there are no SCADA signals configured, you can click on the "..." button next any of the signal fields in the dialog. This will open the SCADA Signals dialog, which will enable you to connect to your data source. For more information on SCADA Signals, review the Help topic on these or visit the SCADAConnect Simulator article.
The required fields for the Pump Performance Study are the pump flow, the suction and discharge pressures and the elevation of those gauges. If your SCADA data for pressure is logged as the tank level for a nearby tank, you can change the data type to use Level instead of Pressure. The tank water level should reference the same datum as the pressure gauges.
In addition, you can also calculate the efficiency of the pump using power data from SCADA data by selecting the “Compute Efficiency” box. This requires a SCADA signal representing the power. The power units is assumed to be in kilowatts.
Once this data is selected, click the Next button, which will validate the study, including the time period for which data will be imported. This can be done by picking a start and end time or a start time and either days ahead or behind.
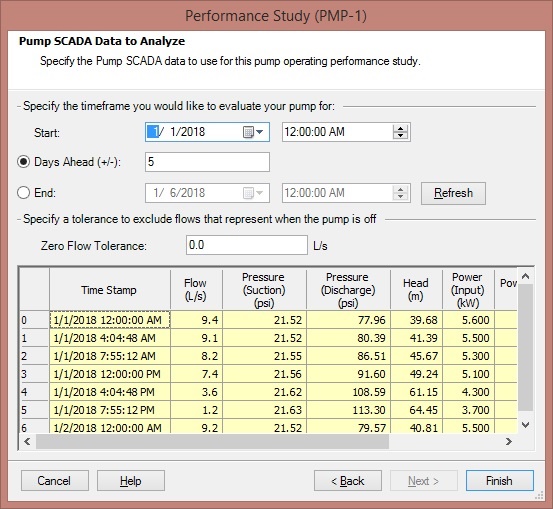
This page retrieves the data from the SCADA signals and displays it in the provided table. Several of the columns are automatically calculated based on other data in the table. When you click Finish, you see a graph showing the pump curve and the pump's efficiency curve, as well as point data from the SCADA data.
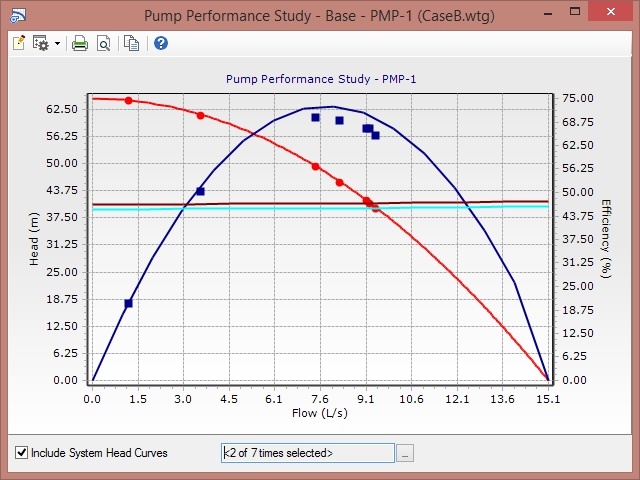
By default, the head curve of the pump definition is always included and is displayed in red. The red, circular points represent the flow and calculated head values from the SCADA data source. If you are also plotting efficiency, this will appear in blue. In addition to viewing the data, if you hover your mouse over a point in the graph, you can view numerical results that occur at this point in the curve or at a given SCADA data point.
It is also possible to include system head curves. To include this, check the box next to “Include System Head Curves.” To select the times to view the system head curve for, click the […] button to the right. The times are based on the active scenario’s hydraulic time step and duration.
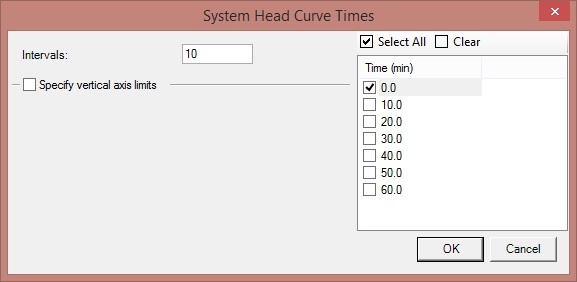
After selecting the times you want to view, click OK. When you return to the Pump Performance Study graph, the system head curve at the selected times will appear, and the text box will display the number of selected times out of the total number available, i.e., "<2 of 7 times selected>". You can also specify a range for the vertical axis. Check “Specify vertical axis limits” and enter in a minimum and maximum head value.
For a constant speed pump, the imported data points should lie on the curves. If the points lie below the curve, then there is likely some problem with this pump. If they lie above the curve, there may be a problem with the data (e.g. a changed impeller). Ideally, the points will be clustered near the pump’s best efficiency point. For a variable speed pump, the curves refer to the pump running at its nominal full speed. If the pump is running slower, the points will appear below the displayed curves and their location will depend on the pump controls.
See Also
Understanding System Head Curves in WaterGEMS, WaterCAD, and SewerCAD
Using SCADAConnect Simulator
What's New in WaterGEMS and WaterCAD CONNECT Edition Update 2