| Product(s): |
WaterGEMS, WaterCAD |
| Version(s): |
CONNECT Edition, V8i |
| Area: |
Output and Reporting |
Problem
The pump result field "Status (Calculated)" indicates "on" or "off". How can this be graphed?
Solution
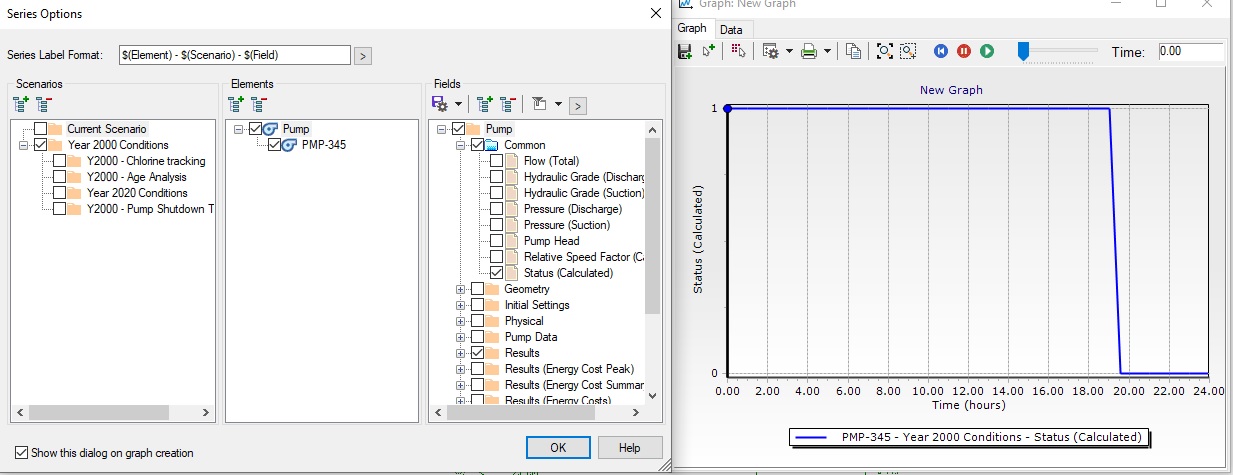
Starting with WaterGEMS and WaterCAD CONNECT Edition Update 2 (build 10.02.02.06), you can now graph the pump status directly. If you graph a pump, the Graph Series Options will included an option for "Status Calculated," which will generate a graph where if the pump is one, it will have a value of 1 and if the pump is off, it will have a value of 0.
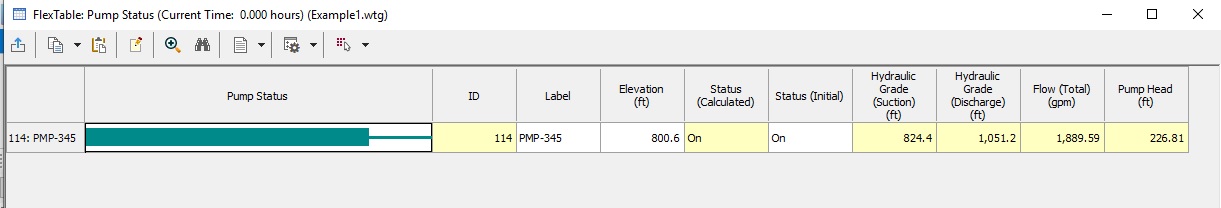
In addition, there is a Pump Status FlexTable. This includes important properties and results, as a sparkline graph depicting the status. When the pump is on, the link in the Pump Status column is thicker than when the calculated status is On and thinner when the pump status is Off. This sharkline shows the status over the course of the simulation. Other results in the FlexTable are for the current time step.
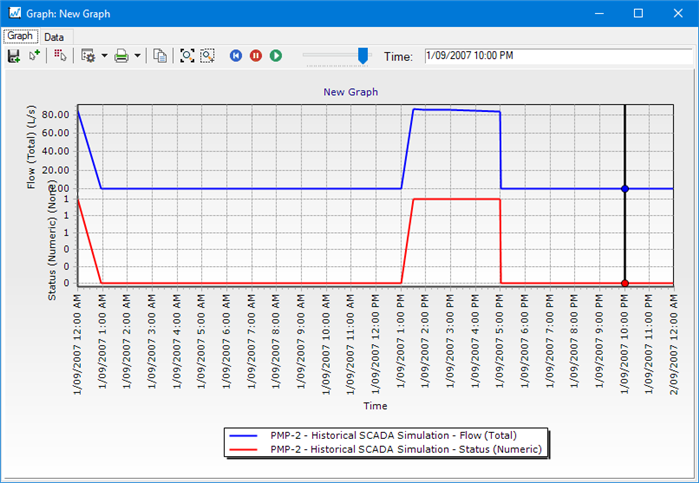
For earlier versions of the application, non-numerical pump status results cannot be graphed. It is possible to use results like pump flow to see the pump status. You can also use User Data Extensions to replicate the pump status graph available in later versions. The following steps can be used to do this:
- Graph the pump flow result field - typically a positive value would indicate on and a zero value would indicate off
- Graph the "Relative Speed Factor" calculated result field. Unless you are using a variable speed pump (VSP), a "1" would typically indicate On and a "0" would indicate Off.
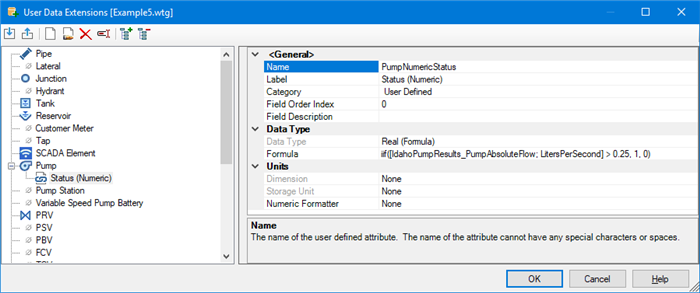
- Create a formula-derived user data extension for pump status, to display a "1" if the flow is positive and a "0" if the flow is zero.