| Product(s): |
WaterSight |
| Version(s): |
10.00. |
| Area: |
Documentation |
It is possible to select different type of views by clicking on the buttons located at the top right corner:
Overview
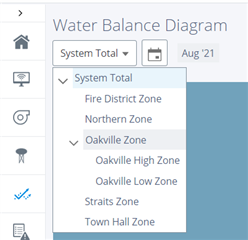
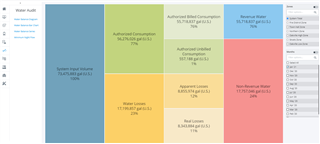
Displays a "Water Balance Diagram" with the volumes for their respective categories according to AWWA and IWA standards. The water balance diagram is calculated based on the explanation below. The buttons above the diagram control the zones for each the Water Balance is displayed, as well as the period selected.

Zones should correspond to isolated areas of the system, surrounded by closed valves and where all inflows and outflows (if exist) must be measured. Zones can include for example DMA (District Metered Areas), pressure zones or operational zones. The configuration of the inflow and outflow sensors as well as tanks levels that may exist inside the zone are configured in the Zones configuration page (at the administration level) by the user.
Regarding the period to analyze, the list allows to select a single month or multiple months for volumes aggregation.
Zones hierarchy
Most utilities manage their systems based on bigger zones (usually called operational zones or distribution systems), being each operational zone or system composed by several smaller zones (usually called DMA). In WaterSight it is possible to consider these two levels of zones hierarchy, but it is also possible to consider three or more levels of hierarchy (for example a town, that is composed by several distribution systems, being each system composed by several DMA).
In the example below, it is being considered a bigger zone (Oakville Zone) that is divided in two smaller zones (Oakville Low Zone and Oakville High Zone). In this case, in the zones configuration table inside the administration page, both Oakville Low Zone and Oakville High Zone should have as parent the Oakville Zone. Please note that in this case the sum of the volumes of the two smaller zones should equal the volumes of the bigger zone.
System Input Volume
Integration along time of the zone flow data (final balance between all inflows, outflows and storage sensors if exist) for the specific month defined by the user. WaterSight uses advanced analytics and machine learning techniques to remove outliers and bad data. The volume is computed for each zone according with the following assumptions:
- negative zone flow values are ignored/excluded,
- flow time series values covered by events categorized as meter failures (manual added by the user or automatically generated by the system and that are assigned to the sensors that enter in the zone balance) are ignored. To know more about how to assign meter failures events please see the following article, under the section "Cleaning Patterns".
- for gaps in data smaller than 3 hours, missing values are obtained by linear interpolation of the flow time series
- for gaps in data bigger than 3 hours, WaterSight estimates the missing data by taking into consideration the pattern (P50) calculated for each zone
- by default, system Input volume is only calculated if there is at least 75% of the time flow data available for that specific month. If data available is less than 75% for that specific month, WaterSight will not compute the monthly volume and a value of zero will be displayed. However the user can change this 75% threshold in the zone administration page. More information here, under the Recompute Data section.
Revenue Water and Authorized Billed Consumption
These components are automatically calculated from the billings obtained for each zone zone (based on the customer billing files and customer meters characteristics file uploaded at the Administration level). It is important to assure that customer meters information (billings and meters geolocation) is up to date, to assure reliable computations of the revenue water per zone. Ideally, this information should come from the billing system.
Non-Revenue Water
The difference between the System Input volume and the Revenue Water.
Authorized Unbilled Consumption
This value is defined by the user in the Zones Configuration page, as a percent of billed consumption. If no value is defined by the user, WaterSight will assume zero.
Authorized Consumption
This is a calculated value. It corresponds to the sum of the Authorized Billed Consumption and the Authorized Unbilled Consumption.
Real Losses
WaterSight allows two different approaches for calculating real losses:
- bottom up approach: real losses are calculated based on the minimum nightly flow (MNF) of each zone;
- top down approach: user defines a value for the apparent losses and the real losses are obtained by subtracting the apparent losses to the water losses.
Each zone can have a different method for real losses and apparent losses calculation. The method to be used for each zone is defined by the user in the Zones administration, being the default one the computation of the real losses based on the minimum nightly flow.
Real Losses calculation based on the minimum nightly flow (MNF)
This component is calculated based on the minimum nightly flow (MNF) of each zone, for each month. The MNF is calculated using statistical analysis, based on the percentile 5th of the zone flow time series and is available in Zone Report, under Daily Minimum tab.
The MNF occurs when the consumption is the lowest inside the zone, and usually this occurs during the night between 2 AM and 5 AM where most people are sleeping and therefore most flow is assumed to be real losses (burst leakage and background leakage), as exemplified in figure below.
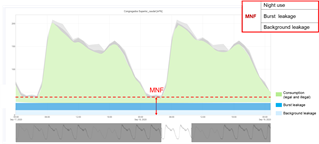
Figure 1 - Decomposing the zone flow time series
There are however some exceptions where some zones may have significant consumption during the night such as industrial zones or areas with bars and hotels or tourist places. In those cases, it is important to assess the night consumption or use other methods such as the top down approach (estimating first the apparent losses).
In the Zones Configuration page the user can define a percentage of the MNF that is due to consumption, in order to exclude the minimum nightly consumption from the real losses volume calculation. If no value is defined by the user, WaterSight will assume zero, and a conservative value will be calculated. For more information about estimating night consumption, you can take a look here.
To mention that real losses volumes are being calculated based on a MNF, assuming that the real losses flow (calculated by subtracting the zone MNF to the MNF consumed) obtained during the night period is constant along the day. This is assuming that pressure does not change very significantly along the day for each zone (night day factor is assumed to be 24 hours). Results must be analyzed carefully in case there are significant pressure changes along the day inside a particular zone. In this case the real losses flow can significantly change along the day (usually real losses flow is higher during the night when pressures are higher, and is lower during the day when pressures are lower).
For more information please go to the Zones administration help page.
Apparent Losses
If the water losses method considered (defined by the user in the Zones administration) is to calculate real losses based on the minimum nightly flow (where night consumption is also accounted) - default method - then in this case the apparent losses component is obtained by subtracting the real losses to the total water losses.
Another approach is having WaterSight directly calculating the apparent losses component. WaterSight can calculate apparent losses based on:
- Apparent losses volume as an user defined percentage of the total zone input volume OR
- Apparent losses volume as an user defined percentage of the total zone revenue volume OR
- Apparent losses volume as an user defined percentage of the total zone water losses volumes.
The methodology to use is defined by the user in the Zones administration.
Water Losses
Calculated as the difference between Input Volume and Authorized consumption.
Water Balance Data Reliability
Water Balance data reliability and accuracy can be significantly affected due to several factors such as:
- Customers are not updated or not assigned to the correct zone,
- Zones balance are not correct (definition of all input, output and storage sensors),
- Some sensor is/got misconfigured,
- Boundary valves between zones that are assumed to be closed, and that are in fact opened (field work validation to check the status of all zones boundary valves may be an important task),
- Water utility is unaware of any large customer with significant consumption during the minimum nightly flow period,
- Night-Day factor is assumed to be 1 in WaterSight. Real losses volumes are being calculated based on a MNF, assuming that the real losses flow (calculated by subtracting the zone MNF to the MNF consumed) obtained during the night period is constant along the day. This assumption can work well for zones with small pressure variations along the day, however in some cases, such as zones that are regulated by PRV with more than one setpoint for example, results should be analyzed carefully (the higher the pressure, the higher the background leakage flow; the lower the pressure, the lower the background leakage flow).
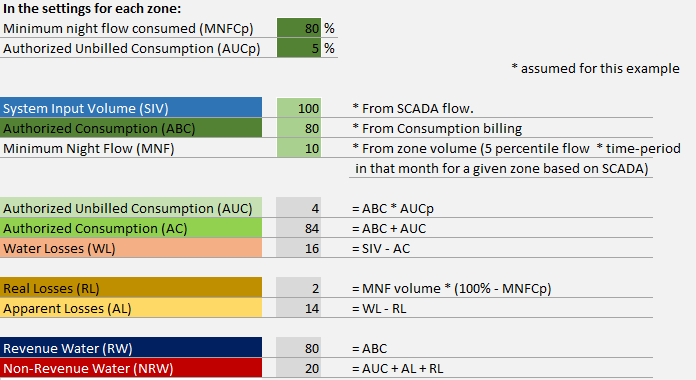
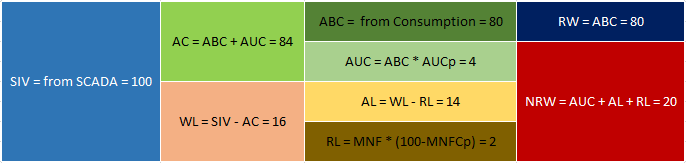
Calculation Example
Example of a Water balance calculation (real losses calculation based on the MNF):
See also
Zones Administration settings
Estimating Night Consumption
OpenFlows WaterSight TechNotes and FAQ's