| Product(s): |
WaterSight |
| Version(s): |
10.00. |
| Area: |
Documentation |
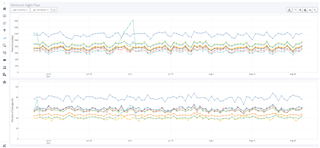
This page displays the minimum night flow (MNF) indicators and value for selected zones across the selected time range.
MNF Indicator
This page allows to pick the minimum night flow value in flow units or the derived "per Connection" value. This drop-down selection will only change the graph above, while the graph located below always show the same indicator (MNF based on percent of average).
MNF value
The MNF value is obtained using some machine learning algorithms to first clean the data and then applying some statistical algorithms (based on the 5th percentile of the zone flow time series) to calculate the value for each day. For example if the MNF value for day 10 is 20 l/s, this minimum value is calculated for the time period between 00h:00mm and 23h:59mm of day 10.
MNF based on percent of average
The MNF based on percent of average gives similar information as the ratio between minimum and median flow, described in the Zone Details. High value means that the minimum flow is closer to the average flow, and therefore there is a higher probability of the zone having high levels of real losses. The average value is also obtained using some machine learning algorithms to first clean the data and then applying some statistical algorithms (based on the 50th percentile of the zone flow time series) to calculate the best fit for the normal/average zone values (for flow time series, the percentile 50th is usually a better indication of normal average values in the system than the direct average, as the average calculated value is much more affected/influenced by anomalies or wrong data).
MNF per connection
The minimum night flow per connection indicator is a KPI (Key Performance Indicator) adapted from AWWA (American Water Works Association) and IWA (International Water Association) and it is usually used to compare leakage between different zones. It is obtained by dividing the MNF volume per day (calculated based on the minimum night flow) by the number of service connections of each zone. By dividing by the number of connections, it is possible to directly compare leakage levels between zones with very different sizes.
The MNF value is a good indicator for tracking leakage in the same zone (an increase in the MNF value along several days can be caused by leakage in the network) however it is not a good indicator to directly compare leakage between different zones, as the zone size also plays an important role: generally big zones have a bigger MNF than smaller zones. To compare leakage between different zones, the MNF per connection indicator should be used. MNF data may provide more insights in zones with low flow since a single leak will have a bigger impact on MNF values.
Note: you can get similar results for the MNF in each zone, if you go to the Zone Details page and select the Integration type Daily Minimum. The difference between the Daily minimum value presented in the Zone Details page and the MNF value presented in the Minimum Night Flow page (inside the Water Audit) is that the first one is calculated considered the raw re-sampled time series (no cleaning data), while the second is calculated based on a cleaned time series, where bad data is removed through the use of machine learning techniques, so that MNF indicators can be more accurate.
Time Range
Time period considered for displaying the values in the graphs. Available options are "Last 7 days", "Last month", "Last 3 months" and "Last year"
Zones 
List of configured Zones. Select the ones to include in the graphs.