| Product(s): |
WaterSight |
| Version(s): |
10.00. |
| Area: |
Documentation |
Overview
This page is used to compare actual pump performance to expected pump performance. It can be used to identify pumps that are operating inefficiently, pumps in danger of cavitation, and pumps that are degrading in performance which might require maintenance.
The back arrow navigates to the previous page. Clicking on the down arrow expands a list of all pumps. Select any pump to view the associated graphs.

Manage Series
By default, a single series showing operating points from the previous 7 days is displayed. The Manage Series option allows the date range to be edited, as well as adding additional series with different time periods for comparison. This is particularly useful to evaluate whether a pump is degrading over time. The trash icon will remove the series.
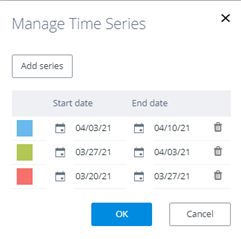
The color for each series may be adjusted by clicking on the series color.

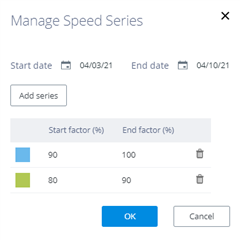
If the pump is a Variable Speed Pump, and the graph option is set to view speed series, the series options have a single date range for all series, and allow multiple series with different speed ranges.
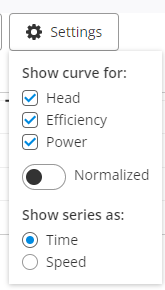
Settings 
Select which graphs to display: flow-head, flow-efficiency, flow-power.
All sensor raw data is resampled to a common 15 minutes time step, and one operating point is displayed for each time step in the specified time range. If a status signal is configured, operating points will not be displayed for time steps where the pump is off.
Information about the pump such as the SCADA signals and Factory Curves are configured in the Pump Configuration page. Each graph will show as much information as is available. Graph elements that depend on information which is not available or not configured will be omitted.
The Head graph shows the pump head vs. flow curve, together with pump operating points (flow vs head). Pump flows are obtained based on the pump flow SCADA signal. Pump heads are calculated based on the suction SCADA signal and discharge SCADA signal, which can be either pressure or level signals. If the flow or discharge signals are not configured, the operating points will not be calculated. If the suction signal is not configured, the suction pressure will be assumed to be 0.
The Efficiency graph shows the pump efficiency vs. flow curve, together with pump operating points (efficiency vs flow). Pump efficiency is calculated based on pump SCADA flow, calculated head and SCADA power signal.
The Power graph shows the power vs. flow curve together with pump operating points (power vs flow). If no Power signal is configured but an efficiency curve is available, the power points will be estimated by calculating the water power from flow and head and adjusting based on pump, motor, and variable speed efficiencies.
If the current pump is a Variable Speed Pump, additional options are available:
- The Normalized option will recalculate all operating points to display the theoretical values at full speed, using the Pump Affinity Laws. See the discussion on Variable Speed Pumps below.
- Show series as Time allows multiple series to be added using the Manage Series button, with each series showing a different time range.
- Show series as Speed allows multiple series to be added using the Manage Series button, with each series showing the same time range but grouping by pump speed. If this option is selected, additional color coded curves will also be displayed that show how the Factory Curve is adjusted by the speed, using the upper bound of the speed series.
Graphic Tools
Use the graphic toolbar to control the legend and display of the charts shown on the pump card.

Side Panel - Average performance
Average performance variables for the period defined under Manage Series. By default, last week period is considered. If the user changes the period, automatically all average performance values displayed are updated to reflect the new selected period. If multiple series are selected, the values are related to all periods defined.
- Flow: Average pump flow for the period defined under Manage Series
- Head: Average pump head for the period defined under Manage Series
- Efficiency: Average pump efficiency for the period defined under Manage Series. Efficiency values are calculated based on pumps signal flow, head and power (in case it exists). If power signal does not exist, this value is estimated
- Power: Average pump power for the period defined under Manage Series
- Total Energy consumed: Total energy consumed by the pump for the period defined under Manage Series
- Target Energy: Energy that would be spent or consumed (for the period defined under Manage Series) if a new pump was installed and operating at the target efficiency defined by the user (for similar operating conditions of flow and head). Pump target efficiency is defined by the user in the administration >> settings >> service expectations >> pump efficiency target.
- Energy difference from target: It is the difference between the total energy consumed by the pumps and the total target energy defined. Corresponds to the extra energy spent by the utility by having the pump operating with an efficiency lower than the expected (target efficiency). In case it is negative, then the target efficiency defined by the user is below the actual efficiency, and the user should probably set a more ambitious goal.
- Cost difference from target: corresponds to the energy costs the utility is incurring by having the pump operating with an efficiency lower than the expected (target efficiency). Energy cost is calculated assuming an average effective unit price for energy (configured by the user in the Settings page - Costs, under administration);
- Invalid Efficiency points: percentage of points that were excluded from the analysis for the defined time period. Invalid points are excluded from the calculation of the pump efficiency and are also not displayed on the pump graphs. This includes for example cases:
- where the pump SCADA power is 0 and the flow & head are non-zero (meaning efficiency calculation would be infinity)
- SCADA power is unrealistically low or the flow unrealistically high, which would mean an efficiency greater than 100%
Side Panel - Realtime performance
Real time values for each pump: flow, head, efficiency, power and speed. Efficiency values are calculated based on pumps flow, head and power.
Side Panel - Sensors
Sensors associated to the pump (defined in the administration). Clicking directly on the name of each sensor will directly redirect the user to the detailed graph of that individual sensor.
Interpreting the Head Curve Graph
In case there is not sufficient data to calculate the pump operating points for the defined time period (sensor data missing), an orange message is displayed informing the user that there is not sufficient data available. In case there is data but the pump status or flow indicates the pumps is off, an informative blue message is displayed informing that the pump is off for the defined period.
The Design Point is an operating point typically defined prior to selecting a pump to install and represents one operating condition that the pump is expected to be able to satisfy. It may or may not fall exactly on the Factory Curve, as sometimes the pump that is installed does not exactly meet the design expectations.
The Factory Curve for head is provided by the pump manufacturer. This represents the expected behavior when the pump is operating at full speed. The colored points represent the actual operating conditions and are calculated based on:
- actual pump flow and head (discharge pressure or downstream tank level and suction pressure - optional)
- if SCADA data is not available for each individual pump but there are signal for the all pump station - in that case, flow and head for each individual pump can be estimated/derived based on the total pump station flow and head and based on each pump status signal. More information here.
Interpreting the head curve graph:
- Each point represents one 15 minute time step.
- If all of the operating points line up on the Factory Curve, this is an indication that the pump is operating at the flow and head conditions predicted by the pump manufacturer.
- If the points are significantly above the Factory Curve, it is likely that the factory curve does not match the actual pump. Confirm that the correct curve for the pump and impeller size have been entered in the Pump Configuration page. It is also possible that the SCADA signals are not properly configured or giving erroneous results.
- If the points are significantly below the Factory Curve, this typically means one of three things:
- The pump is a Variable Speed Pump. See below for more information.
- The factory curve does not match the actual pump. Confirm that the correct curve for the pump and impeller size have been entered in the Pump Configuration page.
- The pump is degrading and may require maintenance. In these cases, the points will often be closer to the Factory Curve at low flows, and deviate more at higher flows.
- If the operating points are clustered close together, the pump typically operates at a consistent flow rate and head condition. A wide spread indicates that the pump encounters a variety of head conditions, resulting in a large range of flows.
- Ideally the points will be roughly in the middle third of the graph. If the pump operates either at very low flows (high head) or very high flows (low head), there is risk of cavitation that could damage the pump. Consider adjusting the head conditions, adjusting the impeller diameter, or selecting a different pump.
Interpreting the Efficiency Curve Graph
In case there is not sufficient data to calculate the pump operating points for the defined time period (sensor data or pump curves missing), an orange message is displayed informing the user that there is not sufficient data available. In case there is data but the pump status or flow indicates the pumps is off, an informative blue message is displayed informing that the pump is off for the defined period.
The Best Efficiency Point is the flow rate at which the pump is most efficient when at full speed. The Factory Curve for efficiency is provided by the pump manufacturer. This represents the expected behavior when the pump is operating at full speed. The colored points represent the actual operating conditions based on SCADA values. Each point is represents one 15 minute time step.
For the flow-efficiency operating points those are calculated based on the following:
- If there is power signal available: calculated based on the actual pump flow, head and power (more complex if variable speed pumps).
- If there is no power signal available: flow-efficiency operating points estimated based on actual pump flow, efficiency curve and motor efficiency. In this case an informative message will be displaying informing that data is estimated.
- if SCADA data is not available for each individual pump but there are signal for the all pump station - in that case, flow, head and power for each individual pump can be estimated/derived based on the total pump station flow, head and power and based on each pump status signal. More information here.
Note: Currently, the Factory Curve represents the pump efficiency, whereas the operating points represent wire-to-water efficiency including the pump, motor, and variable speed drive. Therefore, the operating points are expected to display lower than the Factory Curve.
Interpreting the curve:
- The closer the operating points are to the Best Efficiency Point, the less energy is being wasted.
- If points are significantly above the Factory Curve, it is likely that either the incorrect Efficiency Curve has been defined, or there is a problem with the SCADA signal configuration or values.
Interpreting the Power Curve Graph
In case there is not sufficient data to calculate the pump operating points for the defined time period (sensor data or pump curves missing), an orange message is displayed informing the user that there is not sufficient data available. In case there is data but the pump status or flow indicates the pumps is off, an informative blue message is displayed informing that the pump is off for the defined period.
The Factory Curve for power is provided by the pump manufacturer. This represents the expected behavior when the pump is operating at full speed. The colored points represent the actual operating conditions based on SCADA values (actual pump power and flow). Each point is represents one 15 minute time step.
If no power signal is provided the following assumptions are made:
- flow-efficency operating points calculated based on actual pump flow, efficiency curve and motor efficiency (more complex if speed pumps)
- power is estimated based on actual pump flow and head and in the previous estimated efficiency. In that case, an informative message will be displaying informing that data is estimated.
- if SCADA data is not available for each individual pump but there are signal for the all pump station - in that case, flow, head and power for each individual pump can be estimated/derived based on the total pump station flow, head and power and based on each pump status signal. More information here.
Note: Currently, the Factory Curve represents the pump power, whereas the operating points represent wire-to-water power including the pump, motor, and variable speed drive. Therefore, the operating points are expected to display higher than the Factory Curve.
Interpreting the curve:
- It is a good practice to periodically compare the measured or estimated power used by a pump to the motor, electrical service, generator, and other electrical components to confirm all components are appropriately sized.
- If points are significantly below the Factory Curve, it is likely that either the incorrect Power Curve has been defined, or there is a problem with the SCADA signal configuration or values.
Variable Speed Pumps
Variable speed pumps can change the shape of the Head Curve by operating a reduced speed. This allows behavior such as operating at a fixed flow rate over a range of head conditions, or adjust the flow rate to maintain a constant downstream pressure. Variable speed pumps are often able to reduce energy costs by consistently operating near the best efficiency point over a range of conditions, or by reducing the flow rate without requiring throttling valves that waste energy.
Because the effective head curve that the pump operates on is variable, the operating points may not align with the Factory Curve even when the pump is in good condition. The points may display in a horizontal line underneath the curve (indicating a fixed head setpoint), or a vertical line under the curve (indicating a fixed flow setpoint), or some other pattern.
In order to evaluate whether the pump is in good condition, the actual operating points can be normalized using the Pump Affinity Laws to show what the flow and head would be if the pump was operating at full speed. This requires a Speed signal to be configured in the Pump Configuration page. Use the Normalized option to toggle between normalized and normal display. This option is only available for Variable Speed Pumps.
In the example below, two series for the pump have been defined. Each is for the first week in April, one year apart. With the normal display showing the actual flow and head, we see a vertical line indicating the pump is holding a constant 300 gpm over a range of head conditions. The points look the same for both years. The points are well below the factory curve, but for a Variable Speed Pump that does not indicate the condition of the pump. Under the normalized view, it can be seen that under full speed the pump would be operating below the Factory Curve, and that of the condition of the pump has degraded over the course of the year. Although the degradation in pump condition has not yet impacted the observed performance, it may be worth performing preventative maintenance and identifying the cause of the issue.
Configuring Pumps
The pump signals configurations and other are characteristics done in the pumps administration page. Two different cases may exist:
- SCADA measurements are available for each pump (minimum required is pump flow and head);
- SCADA measurements are available at the pump station level (minimum required is pump station flow and head) and status (on/off) for each pump;
WaterSigth can automatically handle and calculate operating points for each individual pump for both use cases 1 and 2. More information here.
See Also
OpenFlows WaterSight TechNotes and FAQ's
Pumps administration
Configuring Pumps
Prioritizing Pumps for Replacement