| Product(s): |
WaterSight |
| Version(s): |
10.00.xx.xx |
| Area: |
Documentation |
Overview
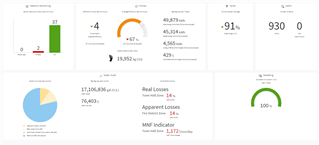
The Home page is the overall dashboard displaying the key performance indicators of the digital twin. These numbers are automatically updated in real time. Please note that this is an already built-in page that automatically gets populated once all the required data is available. However the user has the capability to create their own KPI, graphs, and widgets using PowerBI. More information here.
Network Monitoring
Sensors status summary. Includes all all types of measurements. Classification of the sensors based on the data availability:
| Category |
Color |
Description |
| Offline |
Grey |
Marked as offline by the administrator* |
| No Data |
Red |
(Now – LastInstantInDB) > 4 x MaxLagTime |
| Partial data |
Yellow |
(Now – LastInstantInDB) < 4 x MaxLagTime |
| OK |
Green |
(Now – LastInstantInDB) < 2 x MaxLagTime |
Where MaxLagTime is
15min + Sensor communication Frequency + Sensor Registration Frequency
Last Instant in DB corresponds to the last time step for which values were registered in the database for each given sensor. This time can be seen under Admin >> Sensors, by looking at Last Instant in DB column. Sensor communication frequency and registration frequency are also defined under Admin >> Sensors
* Sensors can be marked as Offline by the user administrator under Administration > Sensors. Offline sensors can represent sensors that have chronical problems (like no data or flat reading), well know by the utility, and for already a long period of time, and the issue is not expected to be solved soon. The majors advantages of having this category are:
- easier to distinguish between temporary problems and failures that the utility might not be totally aware and chronical problems that are already known by the utility for a long time
- make all the real time data ingestion process in the platform more reliable, mitigating degradation of performance or delays on the data pusher tool side.
For more information about sensor status, the user can drill down to the Sensors Status page. Sensors can be added, removed or editable in WaterSight though the Sensor Configuration page.
Pumps
Inefficient Pumps
Number of pumps in the last 24 hours which average performance is below the pump target efficiency defined by the user (defined in the administration >> settings >> service expectations >> pump efficiency target);
Average Efficiency
Average pumps efficiency in the last 24 hours (weighted average).
Total Energy consumed
Total energy consumed during the last 7 days (based on the actual pump flow and head and efficiency values).
Target Energy
Energy that would be spent or consumed if the system was running with new pumps operating at the target efficiency defined by the user (for similar operating conditions of flow and head). Pump target efficiency is defined by the user in the administration >> settings >> service expectations >> pump efficiency target.
Energy Difference from Target
It is the difference between the total energy consumed by the pumps and the total target energy defined. Corresponds to the weekly extra energy spent by the utility by having pumps with efficiencies lower than the expected (target efficiency). In case it is negative, then the target efficiency defined by the user is below the actual efficiency, and the user should set a more ambitious goal. Pump target efficiency is defined by the user in the administration >> settings >> service expectations >> pump efficiency target.
Cost Difference from Target
Weekly costs estimated according with the following expression:
Pumps inefficiency cost = Total Energy costs - Target Energy costs
Where:
- Pump inefficiency costs is also known as cost difference from target,
- Total energy cost is calculated by multiplying the total energy consumed (based on the actual pump flow and head and efficiency values) with the average energy price,
- Target energy cost is calculated by multiplying the target energy with the average energy price.
Pump target efficiency is defined by the user in the administration >> settings >> service expectations >> pump efficiency target. Energy cost is calculated assuming an average effective unit price for energy (configured by the user in the Settings page - Costs, under administration);
Carbon Footprint
Carbon Footprint, in units of CO2e mass (in last 7 days). Environmental KPI that assess pollution impact from the operation of the pumps. The CO2 emission factor (in units of CO2e mass) is configured by the user in the Administration >> Settings >> Service Expectations.
Please note that the number of pumps analyzed may differ from the number of pumps added to the Digital Twin as some pumps may not have all the required data to calculate efficiency. A pump may not be included in the calculation if it doesn't have enough information to produce results for the specified time period. This can happen if there are insufficient sensors and curves configured, if the required sensors have no data, if the pump is off continuously for the time period, or if the calculated efficiency is greater than 100%. More information here.
Tanks
Current System Storage
Total system storage in the last 15 minutes averaged time-step. Total storage is calculated based on each tank current storage (based on current tank levels, maximum level and maximum volume). Tank levels are configured in the Sensor Configuration page and should be associated with the tank element (defined in the Tank Configuration page). Maximum level and volume are also configured in the Tanks Configuration Page.
Alerts
Active
Number of active alerts. This correspond to all alerts generated by the system or manually added by the user that are with the status New, Under Investigation, Field Work or Open. Go to the the Alerts page to see more details about all active events and go to the Alerts Configuration page to know more about how alerts can be triggered.
New
All alerts automatically generated or added in the last 24 hours with the status New. Go to the the Alerts page to see more details about all new events and go to the Alerts Configuration page to know more about how alerts can be triggered.
Water Audit
Global volumes
Water balance components volume for the all system, for the previous complete month. For these components to be calculated the System Total balance (inflows and outflows) must be defined (in the Zones Configuration page) and the sensors entering in the balance must be transmitting data to WaterSight (for more detail please see the Sensor Configuration page). For more detail on how the water balance components are calculated please click here.
Big Figures
Total water losses volume (sum of real losses and apparent losses volume) for the all system, for the previous complete month together with the associated cost. The total water losses cost is obtained by summing the real losses cost (real losses volume multiplied by the average water production cost that is user defined) and the apparent losses cost (apparent losses volume multiplied by the average water tariff that is user defined).
Zone Performance
Identification of the zones with poor performance, regarding: i) highest level of real losses in terms of percentage for the previous complete month, ii) highest level of apparent losses in terms of percentage for the previous complete month and iii) highest MNF indicator, in liters /connection/day (average value in the last 7 days). If the MNF indicator appears empty, make sure that you have defined the number of service connections in each zone (in the zone configuration page).
Modeling
Percentage of successful simulation runs of the model in the last 7 days. The numerical model upload and other simulation settings (run frequency, forecast and hindcast period, etc) is configured in the Numerical Models configuration page.
See also
OpenFlows WaterSight TechNotes and FAQ's