| Product(s): |
WaterSight |
| Version(s): |
10.00. |
| Area: |
Documentation |
Select how to display the Tanks information
Overview
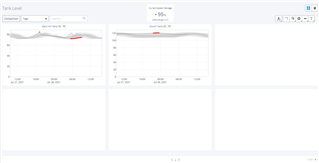
The Tank Overview pager provides an at-a-glance indication if tank variables (e.g. level) lie within the expected range of values. This is particularly useful to quickly spot any anomalies at tanks like overflows (whenever the tank level is above certain value), low tank levels (that can lead to insufficient tank capacity, low pressure or water quality problems) and sudden tank level changes that can be an indication of an anomalous event occurring in the network.
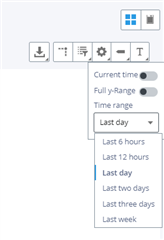
By default 6 level sensor charts are displayed charting readings of the past 24 hours and a forecast of 6 hours. The time range period considered for all graphs can be changed to show last 6 hours, last 12 hours, last 2 days, last three days or last week. To change these configurations please click in the configurations button (inside graphic tools) located on the top right.
The number of tanks to be displayed simultaneously is limited by page - the user has the option to navigate to the additional pages (button below) to see the remaining tanks.
The grey bands on each chart represent the pattern confidence bands computed from one month of historical sensor level data. A pattern corresponds to an expected behavior for the sensor. In OpenFlows WaterSight pattern confidence bands are computed for each sensor using advanced data analytics (statistic equations together with machine learning techniques to remove outliers or bad data). Whenever real data (re-sampled) values, represented as black, red or orange circles go outside the pattern confidence bands, an outlier is identified and the value is color corded with a red circle.
The user can access this same page by going to the Sensor Overview page, and then choose "level" in the Measurement dropdown option button.
Note: Tanks will display in order of descending priority. Tanks with a priority of 0 will not display in the overview. The priority of each sensor - in this case level sensor - is defined at the Sensors configuration, in the administration page.
Current System Storage
Displays information about the current total system storage (considering all tanks)
Comparison
Click here to compare tank variables between different tanks. More information here.
Tags
See the tanks displayed by user defined groups. User defined groups or Tags are defined in the Tank Configuration, under Administration. Please note that if no Tags are defined under zones administration, this field does not appear.
Search
Filters the list of sensors to the ones containing the word fragment typed in (case-insensitive).
For more information about WaterSight, please go to OpenFlows WaterSight TechNotes and FAQ's.