| Product(s): |
WaterSight |
| Version(s): |
10.00. |
| Area: |
Documentation |
Overview
This page can be used to upload any GIS data into WaterSight (through shapefile upload). After the upload, whenever the user goes to a map page in WaterSight he will be able to turn on or off that specific GIS layer. By default, when acceding the GIS administration page, two predefined rows will exist: Zones and Pipes, but the user can upload any other shapefile, see more information below.
Besides upload of shapefiles, WaterSight also supports ArcGIS map service connection, including connection to ArcGIS online and ArcGIS Enterprise (on premise). More information can be found here.
This configuration page is also important for the capital planning module of WaterSight, where a pipe shapefile upload is a minimum requirement.
Adding any shapefile 
The user can add any type of shapefile by clicking the add button (+) located above the table. For any shapefile that is uploaded, it must be a Zip file containing the following extensions: cpg, dbf, prj, shp, shx.
After uploading it is also possible to delete  the previously uploaded shapefile or to download it
  .
.
Uploading Zones Shapefiles
Upload Zones shapefile by clicking on the upload symbol located on the right  , in the zones row table.
The user should take into consideration the following:
- It must be a Zip file with at least the extensions: cpg, dbf, prj, shp, shx,
- It must be one shapefile containing all zones (zones must be defined as polygons),
- The zones shapefile must contain a column with the name of each zone, and the header name of that column must be “Name”,
In case a shapefile is already uploaded and the user wants to upload a new one, the user should click on the “Edit” symbol located on the right  , and directly upload a new Zip file containing the new zone shapefiles.
Zones shapefiles upload is needed to create the zones to be displayed in WaterSight. After zones shapefile is uploaded, the user can insert/edit information related with zones in the Zones Configuration page. The zone shapefile can include nested Zones, such as small Zones inside larger Zones. Smaller District Metered Areas (DMAs) are also considered as Zones.
After uploading it is also possible to delete the previously uploaded shapefile or to download it .
Uploading Pipes Shapefiles
Upload Pipes shapefile by clicking on the upload symbol located on the right  , in the pipes row table.
The user should take into consideration the following:
- It must be a Zip file with at least the extensions: cpg, dbf, prj,shp, shx,
- It must be one shapefile containing all pipes,
- The pipes shapefile must contain a column named "ID" (in case the user wants to use the capital planning module),
In case a shapefile is already uploaded and the user wants to upload a new one, the user should click on the “Edit” symbol located on the right  , and directly upload a new Zip file containing the new pipe shapefiles.
Pipes shapefiles are mostly important (minimum required) for the capital planning module. It is a good idea to include as many informative fields as possible to the Pipe shapefile, such as installation year, pipe material, frequency of breaks, etc.
After uploading it is also possible to delete the previously updated shapefile or to download it .
Append Model Results to Pipes Shapefiles 
The button will be disabled if there are no pipes shapefile and hydraulic model uploaded in WaterSight (both need to be uploaded).
User can add main model results statistics calculated within WaterSight to the existent and previously uploaded pipe shapefile by clicking the "append model results" button located above the table. The main goal is to enable the user to query both model results and GIS atributes inside the capital planning module within WaterSight (more information here). It also enables him to easily export and share model results statistics with different stakeholders (by exporting the pipe shapefile with the updated model results).
Model statistics that are calculated and added to the pipe shapefile include:
- Maximum pressure, for the user defined period. Will be added to the pipe shapefile as a new column labeled "P_max_unit"
- Minimum pressure, for the user defined period. Will be added to the pipe shapefile as a new column labeled "P_min_unit"
- Change in pressure, for the user defined period. Corresponds to the difference between maximum and minimum pressure for each pipe during the user defined period. Will be added to the pipe shapefile as a new column labeled "Delta_unit"
- Maximum flow, for the user defined period. Will be added to the pipe shapefile as a new column labeled "Q_max_unit"
- Minimum flow, for the user defined period. Will be added to the pipe shapefile as a new column labeled "Q_min_unit"
- Maximum velocity, for the user defined period. Will be added to the pipe shapefile as a new column labeled "V_max_unit"
- Minimum velocity, for the user defined period. Will be added to the pipe shapefile as a new column labeled "V_min_unit"
- Maximum headloss gradient, for the user defined period. Will be added to the pipe shapefile as a new column labeled "HL_max_unit"
- Minimum headloss gradient, for the user defined period. Will be added to the pipe shapefile as a new column labeled "HL_min_unit"
Note: Max corresponds to the Percentil 95 of all values reported for the specified duration, Min corresponds to the percentil 5 of all values reported for the specified duration. Using percentiles 95 and percentiles 5 allows to remove from the analysis anomalies that may occur during the user defined period such as meter failures, breaks and other events. The intent is those max and min values to be able to represent accurately typical days behavior and not days with anomalies.
When clicking in the button, a pop-up dialog will appear for the user to define the period for which model results will be calculated as well to define the mapping field between the pipes in the WaterGEMS model and in the uploaded pipe shapefile.
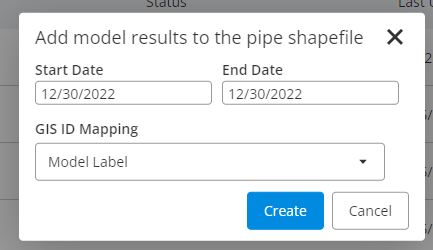
Start and End Date
User defines the period for which model results statistics will be calculated. Please note that the time period defined needs to be within the time window period for which model results exist and are saved in WaterSight. This usually means the last 7 days, or in case an hydraulic model was recently uploaded, the last day/days.
Note: Go to the Realtime Simulation dashboard, to the Previous Simulations page and check for the oldest and most recent dates. This will be the time window period for which model results statistics can be calculated.
GIS ID Mapping
This is where the user defines the mapping field between the pipes ID in the WaterGEMS model and the pipes ID in the shapefile.
For the pipe shapefile, it is a requirement that a column named "ID" exists. Regarding the WaterGEMS model, the matching can be done against the WaterGEMS field called "Label" or the WaterGEMS field called "GIS ID". Best practice is to use a unique ID from the GIS, software, and associate that to the GIS-ID field within WaterGEMS. This supports multiple GIS-IDs for a single pipe, such as in the case of merging multiple pipe segments into a single model pipe.
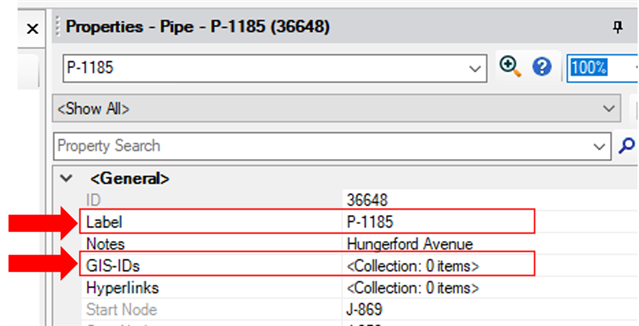
Figure 1 - Label and GIS-ID fields within WaterGEMS application
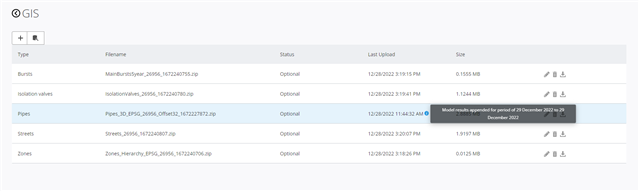
After defining a time period and the mapping and clicking in the "Create" button, and after the process has run, an information symbol with a tooltip will get displayed, with the information that model results were appended to the pipe shapefile and the respective time period that was used (example below). In addition to this, automatically these results will be available inside the capital planning module. More information about how to use the added model results statistics within WaterSight, please click here.
See also
OpenFlows WaterSight TechNotes and FAQ's
Creating Zones Shapefile
Capital planning
Prioritizing Pipes