| Product(s): |
WaterSight |
| Version(s): |
10.00. |
| Area: |
Documentation |
Overview
Select what to configure:
For help information about the value/threshold used in flat reading alerts, see below, under Threshold - Flat Reading section.
Sensor Trigger (or simple condition)
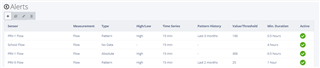
The Alerts administration page is used to setup the triggers for the alerts. The list of alerts automatically generated based on these triggers are displayed on the Active Events page.
To create an alert, the use picks the "+" button in the menu below which is located at the top left of the page.
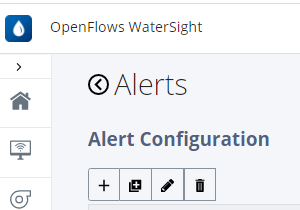
This creates a new row in the Alerts config table. Highlighting a row enables the user to copy, edit or remove a row. Picking edit, enables the user to set up the alert.
To highlight that besides having the possibility to define triggers that will automatically generate alerts, the user can also directly add manual events directly from the graphs, by clicking on the button "Create Event" located on the right side.
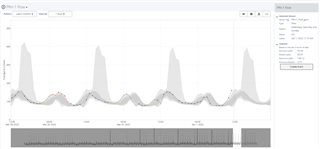
Figure 1 - Add a manual event directly from the graph by clicking in the "Created Event button" located on the right side
Sensor/Zones
The sensor or zone providing the values to trigger alerts. For more information regarding triggering alerts for zones vs sensors, please click here.
Measurement
The measurement of the signal.
Type
Defines the method that is used to evaluate the alert criteria. The user can define 4 different types of alerts:
Type - Pattern
Pattern based alarms are evaluated using the pattern as a reference (pattern is generated based on some historical data and machine learning and statistical equations). For this type, alerts are only generated if all below conditions are simultaneously met:
- time series values are above or below percentile 95th or 5th of the pattern - depending if high or low type is defined (this means that real values go outside the pattern confidence bands and are color coded red), AND
- for the minimum duration defined AND
- and at least one of the outliers has a difference relative to the percentile 50th of the pattern higher than the threshold defined by the user (see below for more information)
An alert informs about an event that may be occurring in the network. Once a pattern based alert is generated, volume lost and duration of the event are automatically computed (more information on the Active Events help page). The event automatically ends whenever real values return to normal, this means values return to the pattern. For high type alerts this means below percentile 80th (values are color coded with a black circle). For low type alerts this means above percentile 20th (values are color coded with a black circle).
Pattern based alarms are useful to trigger and detect anomaly or extraordinary events that don't occur often, and therefore do not make part of the normal behavior/pattern of the zone or sensor. Some examples are events like bursts and leaks, fire events, or a flow meter or PRV malfunctioning (please see this article for some tips how to configure bursts alerts).
The figure below illustrates a pattern based alert, that uses the pattern as a reference.
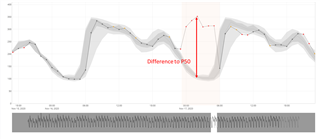
Figure 1 - Pattern based alert.
Taking alert above as an example (Figure 1), the alert gets generated because:
- Difference to P50 is 150 and user defined threshold defined is 100 AND
- Duration of event is 5 hours which is more than the minimum duration defined by the user in the admin (2 hours)
- time series values are all above percentile 95 (all are colo coded red)
Type - Absolute
Absolute based alarms are evaluated directly by comparing real time series values with the user defined threshold. For this type, alerts are generated if all below conditions are simultaneously met:
- All time series values are below or above (depending if high or low type is defined) the user defined value
- for the minimum duration defined
An alert informs about an event that may be occurring in the network. Once an absolute based alert is generated, volume lost and duration of the event are automatically computed (more information on the Active Events help page). The event automatically ends whenever real values are below (for hight type) or above (for low type) the absolute numerical value defined by the user.
Absolute based alarms do not look at the sensor patterns and are useful to identify situations that do not depend on the sensor or zone pattern, like for example problems related with pressure service requirements - pressure below the minimum or maximum required by law - or tank overflows (see this article for some tips how to configure absolute type of alerts).
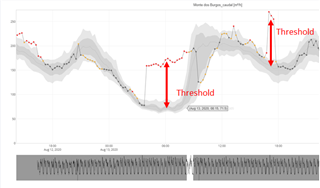
Figure below illustrates an absolute based alert that uses the zero reference.
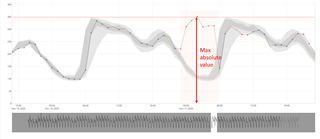
Figure 2 - Absolute based alert.
Taking alert above as an example (Figure 2), the alert gets generated because:
- Max absolute value registered (350) is more then the user defined threshold of 200
- At least during the minimum duration defined by the user in the admin (2 hours), all values registered are above 200
- (note: for the absolute based alerts values do not need to be above percentile 95, so they could be color coded with any color)
Type - No data
A No Data alert is triggered whenever there is no data at all for the specified sensor for the minimum duration defined by the user.
Type - Flat Reading
A Flat Reading alert is triggered whenever there are a specified number of consecutive flat readings (whenever the variance of the sample is below the variance threshold defined), greater than the minimum duration defined by the user. For more information about the variance threshold, see below under Threshold - Flat Reading section.
Figure below illustrates a Flat Reading alert.
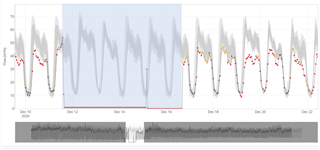
Figure 3 - Flat Reading alert.
The Flat Reading detection algorithm can include data gaps since they are not relevant to analyze consecutive flat data. It's expected at least 75% of data measured within a Event with intermediatte gaps.
High/Low
The user picks High or Low to indicate if the trigger is a high or low alarm.
If the alert is pattern based (please see above), a high alert means that real time series values need to be above the pattern bands (percentile 95th) and a low alert means that real time series values need to be below the pattern bands (percentile 5th).
For absolute based alarms (please see above), a high alert means that real time series values need to be above the absolute numerical threshold defined while low alert means that real time series values need to be below the absolute numeric threshold defined.
Time Series
The user defines the real time series where all trigger configurations will be assessed. Available options are the 15 minutes time series, the daily minimum series and the daily average series.
If the user defines 15 minutes, all trigger conditions defined by the user will be checked every 15 minutes, whenever new data arrives to the software, based on the 15 minutes time series. If the user chooses daily minimum or daily average, all trigger conditions defined by the user will be checked every day (midnight) based on the daily minimum or daily average time series.
The 15 minutes time series are good to track real time events in the system like for example big and medium bursts, flushing, fire events, meter failures, PRV failures, pressure problems, tank overflows and other events. The daily minimum time series are for example good to track leakage in the network, by triggering alarms based on the minimum nightly flow (whenever applied to the measurement type flow). And one example of the benefits of using the daily average time series is to track the increase in volume lost (due to leakages) in big transmission mains along a longer period, where sometimes the daily minimum analysis is not useful - for example because it accounts for tanks draining and filling during the night, etc.
Pattern History
This option is only available for pattern based alerts. The user can choose the time period that will be used to serve as reference to generate the alerts:
- Last month: a pattern that is computed based on last month of sensor data;
- Last 2 months: a pattern that is computed based on last 2 months of sensor data;
- Last 3 months: a pattern that is computed based on last 3 months of sensor data;
- Last 6 months: a pattern that is computed based on last 6 months of sensor data;
- Last 12 months: a pattern that is computed based on last 12 months of sensor data;
The user can analyses the differences between the patterns before configuring the alerts, by entering in the sensor details page, and then changing the Pattern dropdown option.
Threshold
The user defined value from which an alarm can be automatically generated.
Threshold for Pattern - type alerts
For pattern based type, the threshold value is compared against the difference between the real time series value and the pattern (percentile 50th). In case the difference to percentile 50th is bigger than the user defined threshold, then the condition is met and an alert can be triggered (if other conditions area also met: minimum duration and being above percentile 95 for high type alerts or below percentile 5 for low type alerts). For burst detection, this threshold usually defines what is the leak/burst flow needed to trigger the alarm.
Threshold for Absolute - type alerts
For the absolute based type, the threshold value is compared against the absolute value registered by the time series. For high type it means a real time series value above the threshold while for low type it means a real time series value below the threshold.
Note: The Value/Threshold units are those defined in the Digital Twin settings, under Administration.
|
Pattern based alert
|
Absolute based alert

|
Threshold for Flat Reading - type alerts
For Flat reading type alerts, the threshold value corresponds to the variance. In WaterSight, when a flat reading alert is created, a default value is always assumed/estimated. Please do not change the variance, unless strictly required (this means only in case the solution is generating false positive alerts).
The variance corresponds to a statistical measurement of the spread between numbers in a data set. More specifically, variance measures how far each number in the set is from the mean (average), and thus from every other number in the set. Below there is an excel with some instructions to guide the user in the definition of the variance value for flat reading alerts, in case the WaterSight default value is not giving the best results. The variance can be calculated using the normal variance function in excel.
8475.WaterSight - Target Variance - Flat Reading Alert.xlsx
Min. Duration
It defines the minimum number of consecutive outliers needed to generate the alarm.
For pattern based alerts, this corresponds to the minimum duration in which all time series values are above percentile 95th - for high type - or below percentile 5th of the pattern - for low type (and will be represented as red dots in the graphs).
For absolute based alerts, this corresponds to the minimum duration in which all time series values are above the user defined threshold - for high type - or below the user defined threshold - for low type.
Note: Minimum duration variable is used simultaneously with the threshold variable in order to trigger the alarms. For pattern based, alarms will be generated when all time series values are above or below percentile 95th or 5th of the pattern, for the minimum duration defined, and at least one of the outliers value has a difference relative to the percentile 50th of the pattern higher than the threshold defined (if the user does not insert any threshold value, zero will be assumed). For absolute based, alarms will be generated when all time series values are above or below the user defined threshold, for the minimum duration defined.
Active
Alarms are only generated for sensors that have an active configuration. The user has the option to turn off alarms generation for a specific sensor by changing this option to inactive.
Recipients
Group of people inside the organization that will get alert notification by email, once they are generated in WaterSight. The identification of the groups and people that will receive the alerts is done in the Subscriber Groups tab.
Display on Tank
If this option is enabled, tank alerts will be displayed in the tank schematic overview page.
See also
Active Events
Configuring bursts alerts
Absolute based alerts
Subscriber groups
Combined Condition events
OpenFlows WaterSight TechNotes and FAQ's.