| Product(s): |
Bentley WaterGEMS, WaterCAD |
| Version(s): |
CONNECT Edition, V8i |
| Area: |
Output and Reporting |
Overview
The purpose of this TechNote is to review the features and use of the Post Calculation Processor available in WaterGEMS and WaterCAD. Additional information can be found in the Help documentation.
Background
The Post Calculation Processor is a tool that allows you to run simple statistical analyses on results obtained from computing an extended period simulation (EPS). These results can be displayed in the element properties or FlexTables as User Data Extensions.
Note : For storm-sewer products the similar tool is called Statistics found at (Analysis > More > Statistics). In case of dynamic solvers specifically explicit solver, long term continuous simulations (LTCS) results generate lot of output data, in that case statistics tool is helpful to look at statistical results, here you can save multiple analyses in Statistics manager just like creating multiple scenarios in one model. This wiki includes more information on Statistics tool for storm-sewer products like SewerGEMS, CivilStorm.
Post Calculation Processor Properties
The Post Calculation Processor is a simple dialog consisting of a few fields, including the start and stop times, the statistic type (such as Mean, Sum, or Standard Deviation), the WaterGEMS property field the analysis will use, the output property (or User Data Extension), and the operation type.
.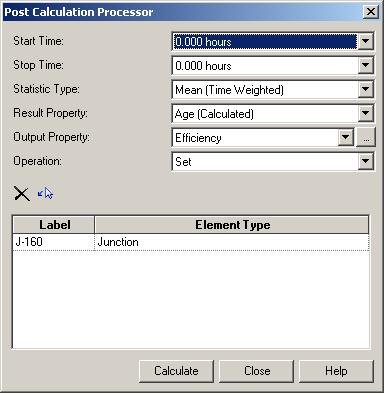
There are also Delete and Select From Drawing icons, as well as the Calculate button that will run the statistical analysis.
Opening Post Calculation Properties
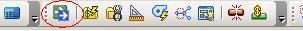
The Post Calculation Processor can be accessed by going to the Analysis pulldown and selecting Post Calculation Processor. It can also be open from the Post Calculation Processor icon in the toolbar.
After selection this, a small Select dialog will open.
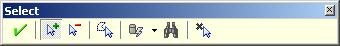
The Select tool is common in the hydraulics and hydrology software and is used in a number of different tools. In this case, it allows you to choose the elements that will be included in the analysis. The default setting for the dialog is that the Add icon is selected. With this, you can click on any element in the model for inclusion in the analysis. It will highlight in red on the drawing pane. Conversely, you can also remove selections by choosing the Remove icon. The Select dialog also allows for you to choose a selection based on a polygon or query. Unless you are selecting only a few elements, the Query icon may be the most efficient as it allows you to select an already-created Selection Set of elements.

Note: For more information on Selection Sets, please review the Help topic on that subject.
You can also use the Query icon to select all of a given element, such as all junctions in the model. To do this, select Network > All Junctions.
Once you have selected the elements in the drawing, choose the green checkmark icon. The Post Calculation Processor dialog will then open.
Note: You can select the elements for analysis later if you wish. To do this, choose the green checkmark icon without making a selection on the drawing pane. The Post Calculation Processor will then open. You can then select the “Select from Drawing” icon in the Post Calculation Processor, which will open the Select dialog described above.
User Data Extensions
As mentioned earlier, the Post Calculation Processor requires the analysis results to be saved into an existing User Data Extension (UDX). The UDX can either be created ahead of time or from the Post Calculation Processor. The UDX dialog can be accessed directly by going to Tools > User Data Extensions.
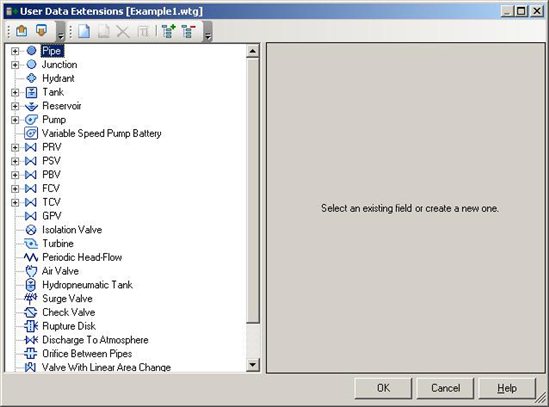
Note: You can also open the UDX dialog directly from the Post Calculation Processor dialog by select the ellipsis (…) button next to the Output Property field.
To create a UDX, highlight the element and select the New icon. The section on the right will fill in with default data. More than likely the results of the statistical analysis of the Post Calculation Processor will be a “real” number, or a non-integer. Because of this, change the Data Type to “Real”. When this is completed, the Units section will appear. Enter the appropriate Dimension, Storage Unit, and Numeric Formatter for analysis you will be conducting. You should also change the label to something recognizable for the analysis. Once you have done, select Okay.
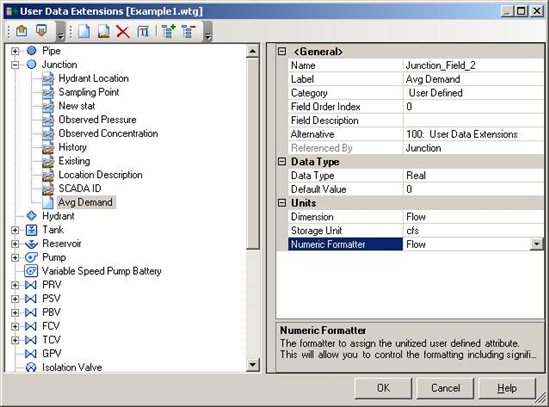
Note: Once you select Okay, some fields such as Data Type, Dimension, and Storage Unit cannot be changed or edited.
Running a Statistical Analysis
Once the User Data Extension is created, you are ready to run a statistical analysis. The Post Calculation Processor is capable of simple statistical analyses, such as means, standard deviations, and sums. A complete list is available by selecting the Statistical Type dropdown menu.
Note: For more complicated calculations, the latest release of WaterGEMS and WaterCAD has the capability of creating formula-based User Data Extensions. For more information on this, see the Help menu or the Creating Formula-Based User Data Extensions TechNote.
To run the analysis, first make sure that you have selected elements in the model. A list will appear in the bottom window of the Post Calculation Processor. Next, choose the start and stop time for the analysis. Then, select the Statistic Type.
Next, select the Result Property. This is the element property you are analyzing. The dropdown will contain all of the Results properties for the element type selected. After making this selection, choose the UDX you created from the Output Property dropdown. Lastly, select the Operation. The most common will be “Set”, though you can also choose to add, subtract, multiply, or divide.
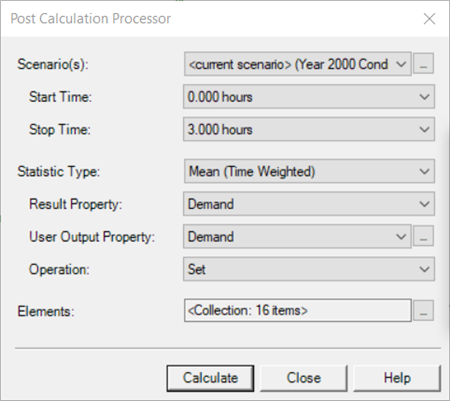
Finally, click the Calculate button. The program will run the calculation and a dialog will appear stating that it is complete and display the number of elements affected.

Batch Run function in CONNECT Edition Update 1
Starting with the release of WaterGEMS and WaterCAD CONNECT Edition Update 1, you can now run a batch run in the Post Calculation Processor. This will save time when you want to save a given statistic result for multiple scenarios. After computing the scenarios, you can choose them from the selection window at the top of the Post Calculation Processor. Any elements you select will be included in the output User Data Extension. When you change the active scenario, the results in the output User Data Extension will be updated.
Note: You will need to create a new User Data Extension alternative for each scenario. If this is not done, only the latest value will be applied to the User Data Extension used to assign the data.
Viewing Results
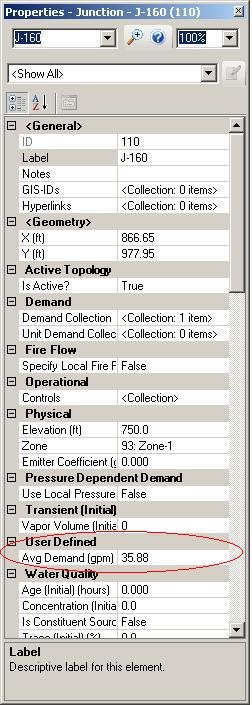
Since the results are saved into a user data extension, you can view the results in either the element properties or the FlexTables.
To see the results in the properties, double-click on one of the elements that were analyzed to open the Properties dialog. You will find the name of your UDX under the section “User Defined”.
To see the results in the FlexTables, open the element FlexTable (through View > FlexTables, for instance). With the FlexTable open, select the Edit icon. Scroll through the list on the left to find the UDX field. The list is in alphabetical order. Select the Add button and it now appear in the list on the right. Click Okay to return to the FlexTable. The statistical analysis results should now be available.
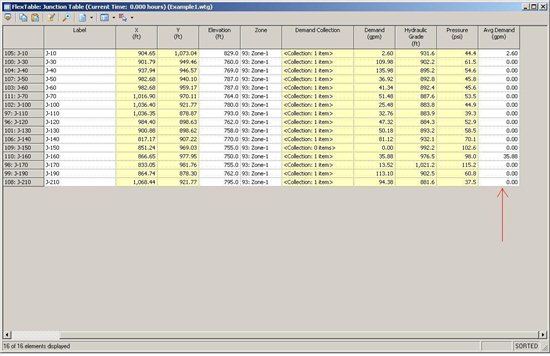
This data is also available for results presentation in graphs and data tables.
See Also
Post Calculation Processor tool error: The result property and output property have no common support element types