| Product(s): |
WaterSight |
| Version(s): |
10.00. |
| Area: |
Documentation |
Overview
The Pump Overview page show side by side graphs of every pump. By default up to 6 graphs are displaying chart readings of the past 7 days. The main goal is to provide an at-a-glance indication if pumps are operating near the expected range of values. Particularly useful to quickly spot pumps that are beginning to fail, or are operating in an inefficient manner. Pumps are configured in the Pump Configuration page.
Pump Details
To see the details of each pump, please click directly on the title of the pump graph (with pumps name).
Manage Series
Allows the date range for the operating points to be adjusted. Additional series may be added with custom date ranges so that pump behavior can be compared across different time periods. For example, adding a series showing values from the same week in the previous year could be used to quickly identify which pumps are changing over time, which may indicate the need for maintenance or the risk of impending failure.

The color for each series may be adjusted by clicking on the series color.

Show By
Changes the relationship in the graphs to either be Head vs. Flow, Efficiency vs. Flow, or Power vs. Flow.

Tags
See the pumps displayed by user defined groups. User defined groups or Tags are defined in the Pump Configuration, under Administration. Please note that if no Tags are defined under pumps administration, this field does not appear.
Search
Filters the grid of pumps to the ones containing the word fragment typed in (case-insensitive).
Graphic Tools
Use the graphic toolbar to control the legend and display of the charts shown on the pump card.

Pump Card
Displays the Pump Name. Click the Pump Name to navigate the Pump Details. If the pump is a Variable Speed Pump, the name will include "[VSP]".

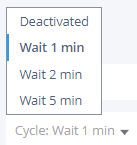
Cycle
When activated, the current pump page will automatically be cycled forward at the specified frequency.
Paginator
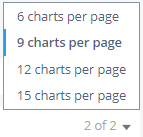
The paginator at the bottom of the page divides the set of available pumps into "pages" and controls which page is being displayed. The number of charts per page can be picked from the "Charts per Page" dropdown.

Charts per Page
The text shows which page is currently displayed. The dropdown arrow allows the number of charts per page to be adjusted.
| Entry |
Grid Size |
| 6 charts per Page |
3 x 2 |
| 9 charts per Page |
3 x 3 |
| 12 charts per Page |
4 x 3 |
| 15 charts per Page |
5 x 3 |
Variable Speed Pumps
Variable speed pumps are indicated with "[VSP]" after the pump name. These pumps can be operated at a lower speed, which adjusts the shape of the head curve and allows lower combinations of flow and head to be achieved without throttling valves that waste energy. The observed operating points for a variable speed pump will often be below the Factory Curve even when the pump is in good condition. For more tools to evaluate the condition of a variable speed pump, navigate to the Pump Detail page.
Interpreting the Graphs
In case there is not sufficient data to calculate the pump operating points for the defined time period (for example missing sensor data or pump curves), an orange message is displayed informing the user that there is not sufficient data available. In case there is data but the pump status or flow indicates the pumps is off, an informative blue message is displayed informing that the pump is off for the defined period.
See Pump Details for more detailed information on how to interpret the graph series.
Note: The efficiency and power Factory Curve are currently displaying only the pump efficiency and power, while the operating points represent the total wire-to-water conditions, the operating points are expected to fall below the efficiency Factory Curve and above the power Factory Curve.
Configuring Pumps
The pump signals configurations and other are characteristics done in the pumps administration page. Two different cases may exist:
- SCADA measurements are available for each pump (minimum required is pump flow and head);
- SCADA measurements are available at the pump station level (minimum required is pump station flow and head) and status (on/off) for each pump;
WaterSigth can automatically handle and calculate operating points for each individual pump for both use cases 1 and 2. More information here.
See also
OpenFlows WaterSight TechNotes and FAQ's
Prioritizing Pumps
Configuring Pumps
Pumps administration