| Product(s): |
WaterSight |
| Version(s): |
10.00. |
| Area: |
Documentation |
Overview
The event detail page can be accessed trough the Active Event page, by directly clicking on the pencil button  located on the right side of the event mini-graph.
In this page the user can have more insights about the event. The start and end date of the event are represented in the graph with a blue shadow. On the right side table there is more information about the event, the trigger conditions that generated the event, and also the identification of the related sensor or zone.
This page also provides a shortcut to the associated sensor or zone where the event has been generated and a shortcut to the comparison page.
Associated sensor or zone shortcut
The user can directly jump to the sensor or zone where the event was generated, by directly clicking on the sensor or zone name located on the right side panel, under the Associated Sensors/Zones section (see below).

Figure 1 - Shortcut to the sensor or zone detail graph
From the sensor/zone details page the user can do additional investigation such as navigate in the time series history or changing the pattern type or time series.
From the sensor or zone detail graph, the user can go back to the general active events list table by clicking in the back button  located on the top left, or directly jump again to the alert detail page by clicking in the respective event highlighted with a purple polygon (see below). In case you do not see the event icon on the sensor or zone graph, please make sure that you check that you enabled the display of closed events, by clicking in the configuration eye button
  located on the top right of the graph.

Figure 2 - Click in the event icon (purple pyramid) to directly jump to the alert detail page

Figure 3 - Closed events by default do not display on sensor and zone graphs. If analyzing a closed event, make sure you enabled them.
Comparison shortcut
The user can directly jump to the measurements comparison by clicking in the "Compare" button  located above the graph (see below).

The user will be then redirected to the comparison page, where will be able to compare different measurements simultaneously in the same graph to better understand the causes of the event. Note that by default the sensor(s) and/or zone(s) associated with the event will be shown (but the user can add other measurements), and the event will be highlighted in the comparison page by a blue shadow (example below).

Graphic Tools
Use the graphic toolbar located on the top right of the graph to control the display of the chart :

| Entry |
Description |
 |
Turn on/off:
- Legend of the graphs
- Signal data
- Events highlighted in the graphs (with the additional flexibility to display only active events or all events)
- Statistics (or patterns)
- Current time marker
- Raw Data (only available if alert is associated with sensor)
- Model Results (only available if alert is associated with sensor)
|
 |
Full y-Range - Y axis will adjust automatically to include the maximum value registered
|
 |
Download data that is being displayed on graphs (PNG or CSV format) |
 |
More graph configurations: spike lines, data tooltip and font size.
|
Properties Panel - Event Detail
Origins
Sensors or zones associated to the event. Will correspond to those associated to the trigger (simple condition or combined condition) defined in the alerts administration page.
Status
Status of the event. The user should update status according with the respective events workflow:
- New: by default all events are generated with this status;
- Under Investigation: change to this status if it is required further investigation, before deciding if the event should be opened or closed or removed;
- Open: change to this status to acknowledge this alert. Also a preliminary analysis should already have been made to filter possible false positives;
- Field work: change to this status if the user is confident that the alert can represent any anomaly in the network and there are already some people in the field looking for the anomaly;
- Closed: the event should only be close whenever the conditions that triggered the alarm went back to normal, and when a cause was identified. If it was not possible to identify a cause, please close the event and categorize it as unknow. If the alert is also considered a false positive, the user can directly move from step 1 to 5.
The user has the option to filter the events that appear on the list. By default the list is always showing all alerts/events that are in progress (this means all alerts that are not closed). More information on alert management workflow, here.
Category
Whenever an alert is generated, the category is always set to unknown, expect if the alert type (configured in the Alerts Administration page) was set to "No Data" or "Flat Reading". In these two last cases, the default category of the event generated is Meter Failure.
After the cause of the event was identified, the user must select the most appropriate field defined in WaterSight: Unknown, Meter Failure, Burst, Leak, Flow Increase, Maintenance Work, Zone Change. Maintenance work includes all operational works developed in the network (flushing, opening/closing valves, etc). Zone Change refers to a temporary or permanent change of the zone layout (by opening/closing valves).
Symptom
This easily identifies the reason why the alert was generated. The symptom is identified based on the user admin configurations defined in the alerts configuration page:
For alert types "Pattern" and "Absolute":
- If an alert was triggered based on a flow time series, high: symptom will be flow increase,
- If an alert was triggered based on a flow time series, low: symptom will be flow decrease,
- If an alert was triggered based on a level time series, high: symptom will be level increase,
- If an alert was triggered based on a level time series, low: symptom will be level decrease,
- If an alert was triggered based on a pressure time series, high: symptom will be pressure increase,
- If an alert was triggered based on a pressure time series, low: symptom will be pressure decrease,
- The exact same logic applies to all other type of measurements used in WaterSight;
For alert types "No Data" and "Flat Reading":
- If an alert was triggered based on the type "No Data": symptom will be No Data,
- If an alert was triggered based on the type "Flat Reading": symptom will be Flat Reading
Start Date
The date the event started (and not the date the alert was triggered). As illustrated in figure below, the alert is generated when the trigger configurations defined by the user in the alerts configuration page are met, however the real event can already have started some hours earlier.

Figure 1. Difference between event start date and date the alert was triggered, for a pattern based alert.
End Date
End date of the event, for which the alert was triggered. For pattern based alerts (please see alerts configuration page for more detail) it is when the event returns to the pattern. For high type alerts this means below percentile 80th (values are color coded with a black circle). For low type alerts this means above percentile 20th (values are color coded with a black circle). For absolute based alerts (please see alerts configuration page for more detail) it is when real values are below (for high type) or above (for low type) the absolute numerical value defined by the user.

Figure 2. Start date and End Date for a pattern based alarm.
Duration
The duration of the event is automatically calculated by the software using the Start Date and End Date (for automatically generated alerts). For manually added alerts, this field must be manually completed.
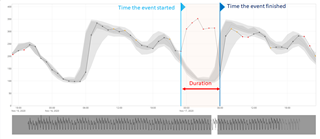
Figure 3. Duration of the event.
Max.Value (or extreme value)
Same as described above, in the Active Events table section.
Lost Volume
Volume lost in anomalies and other events (like bursts, leaks, flushing, fire usage, etc). This volume is automatically calculated by the software for automatically generated alerts, and only for alerts that were generated based on a flow time-series using pattern high as a criteria (please see alerts configuration page for more detail).
The volume is automatically calculated by integrating the difference between real flow and expected flow (the pattern) along time, for the all duration of the event.

Figure 5. Identification of the lost volume.
Exclude From Patterns
The user has the ability to control if an event should be considered for the pattern and forecasts calculations of the sensor or if should be ignored. Generally all alerts that represent anomalous or extraordinary events (such as bursts, leaks, fires, tank overflows, temporary zone changes) should not be considered for the pattern calculations and forecasts of the respective sensor. In these cases the option "Remove From Patterns" should be checked  .
.
By default the alerts types configured as No Data or Flat Reading (configured in the alerts administration) will automatically generate events that will have the option "Exclude From Patterns" enabled (this means that meter failure periods are automatically not considered for the pattern calculation). All other alerts type (pattern and absolute) will generate events that will have the option "Exclude From Patterns" disabled (meaning that those periods will be considered for future pattern calculation) as starting point. However, once an event is correctly categorized, this option will be automatically updated:
- if categorized as meter failure, burst, leak or maintenance work the option "Exclude From Pattern" is automatically enabled/Checked meaning that those periods will NOT be considered for future pattern calculation
- if categorized as unknown or zone change the option "Exclude From Pattern" is kept disabled meaning that those periods will be considered for future pattern calculation.
The user has always the option to override these defaults by manually changing these settings in the Event Properties table, in the Active Events page, by checking or unchecking the Exclude From patterns option.
Please note that if an anomalous (extraordinary) event has occurred and the "Exclude From Pattern" option is unchecked (or either because the user did not categorize the event or because he wrongly override the defaults), those values related to the anomalous events will be considered for the future patterns calculations and forecasts, and with this "polluting" the patterns. For more information please take a look at this article.
Comments
The user can update the event with some relevant comments (for example the type of burst, location, and other relevant information for the utility).
Properties Panel -Trigger Detail
Displays the information related with the configurations of the trigger that generated the alert. Those configurations are defined in the Alerts administration page.
Trigger Name
Name defined by the user for the trigger that generated the event. Trigger name is defined in the Alerts administration page. Not applied for manual added events.
Type
Defines the method that is used to evaluate the alert criteria. The user can define 4 different types of alerts: Pattern, Absolute, No Data and Flat Reading. More information in the Alerts administration page.
High/Low
The user picks High or Low to indicate if the trigger is a high or low alarm. More information in the Alerts administration page.
Time Series
The user defines the real time series where all trigger configurations will be assessed. Available options are the 15 minutes time series, the daily minimum series and the daily average series. More information in the Alerts administration page.
Pattern History
This option is only available for pattern based alerts. The user can choose the time period that will be used to serve as reference to generate the alerts. More information in the Alerts administration page.
Value/Threshold
The user defined value from which an alarm can be automatically generated. More information in the Alerts administration page.
Min.Duration
It defines the minimum number of consecutive outliers needed to generate the alarm. More information in the Alerts administration page.
Properties Panel - Associated Sensor(s)/Zone(s)
Identification of the related sensor or the zone where the event is occurring/occurred. The user can directly skip to the zone or sensor detail graph by clicking in the sensor or zone name.

See also
Active Event page
Alerts Administration page
Excluding from patterns
Alert Management Workflow
OpenFlows WaterSight TechNotes and FAQ's