| Product(s): |
WaterSight |
| Version(s): |
10.00. |
| Area: |
Documentation |
Overview
Reducing Water Losses is amongst one of the main challenges water utilities around the world are facing, being more and more under pressure by municipal authorities, national regulators, private shareholders or public society due to the high impact on operational costs and due to the impacts on water resources management and energy inefficiency.
WaterSight can help utilities around the world reducing water losses, acting in both components of the real (or physical) losses and apparent (or commercial) losses. Figure below highlights the main areas of intervention for real losses and apparent losses reduction (as referenced by IWA Water Loss task force group and AWWA):
Figure 1 - Main areas of intervention of real losses and apparent losses reduction (source: AWWA)
Pressure Management
Reducing pressure is one of the intervention areas to reduce real losses volumes, as leakage flow is directly related with pressure in the system. Also assuring stabilized pressures and avoiding big pressure changes can contribute to lower number of new breaks. However it is important to simultaneously conciliate all this with the required service levels provided to customers.
With WaterSight your entire utility (modelers and non-modeler experts) can have access to real time pressures along the all network, including forecasts. Easily understand and share the network pressure map, including the location of the low and high pressures in your network.
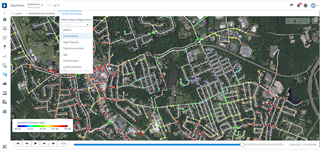
FIgure 2 - Network pressure map
Also easily integrate sensor measurements with model results to predict network conditions more accurately. For more information about model simulations, please click here.
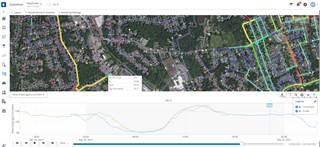
Figure 3 - Integrate sensor measurements as boundary conditions for model runs and directly compare measured data with modeled data
Through the network monitoring module you can easily monitor in real time pressure measurements from SCADA or other telemetry systems and be immediately alerted for any anomalous event such as a PRV malfunction, or high or low pressures in the system. In addition to this, easily understand the impact in the minimum flows due to adjustment of VRP set point for example.
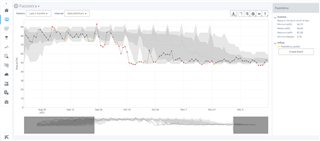
Figure 4 - Minimum night flow evolution from August to December for a specific zone.
Active Leakage Detection
WaterSight can help in the identification of the priority areas for active leakage detection, through the calculation of the following variables:
Both real losses volume and percentage should be always analyzed together. Bigger zones tend to have higher volumes associated, which is an important variable, however active leakage detection efforts should also be done in areas where there is higher potential for reduction, and this usually happens in zones with higher percentages.
Another indicator is the minimum flow per service connection for each zone. By dividing the minimum flow by the number of connections, it is possible to directly compare leakage levels between zones with very different sizes. The ratio between minimum flow and average flow (or minimum flow based on percentage of average) is another indicator used to indirectly assess real losses. High value means that the minimum flow is closer to the average flow, and therefore there is a higher probability of the zone having high levels of real losses. Both minimum flow indicators (minimum flow per service connection or ratio between minimum and average flow) become even more relevant whenever water balance data is not reliable.
Besides the identification of priority areas, WaterSight also allows to efficiently track active leakage detection activities and results through:
- minimum nightly flow analysis for each zone (graph and report)
- real losses evolution analysis along the year (more information here)
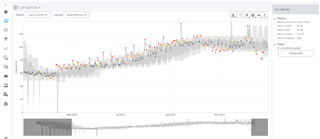
Figure 5 - Minimum night flow for a year period analysis for a specific zone
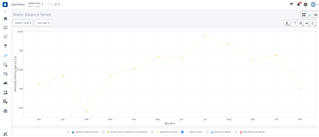
Figure 6 - Real losses volume evolution along the year for a specific zone
Asset Management
Articulate water losses reduction programs with the rehabilitation programs. Maximize real losses volumes reduction by identifying the right pipes that should be rehabilitated, while also considering other variables such as risk. This analysis is available inside the Capital Planning module. In case you don’t have access to this module, please reach to your Bentley contact.
Speed and Quality of Repairs
WaterSight can help reducing repair times by increasing awareness of new breaks occurring in the system. In fact, automatic alarms are triggered whenever anomalies are detected in the system and those become available in the Active Event list for users to manage.
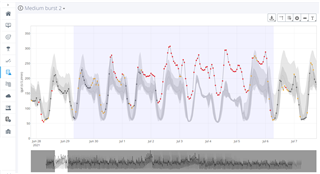
Figure 7 - Example of a medium burst event detected by the software.
Apparent Losses
WaterSight automatically computes water losses and can also quantify the relation between real and apparent losses. To know more on how apparent losses are calculated please see this article.
By calculating apparent losses volume and percentage, the software can help in the identification of priority areas for apparent losses activities (that can include illegal consumptions detection and customer meters replacement). Please note that both apparent losses volume and percentage should be always analyzed together: bigger zones tend to have higher volumes associated, which is an important variable, however apparent losses activities should also be done in areas where there is higher potential for reduction, and this usually happens in zones with higher percentages.
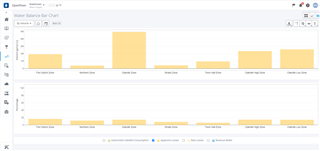
Figure 8 - Apparent losses volume (above) and apparent losses percentage (below) for each zone
Another variable that is calculated is the apparent losses cost. While when reducing real losses there is a direct decrease in the production and transportation costs, apparent losses decrease have a direct impact on revenue. For example, when replacing customers meters that are stopped or under-measuring, there is a direct increase in the revenue by installing new meters; also when illegal connections are detected and the situation is regularized there is a direct increase in the revenues.
The most important message here is that although real losses volumes may be the biggest component on the total water losses volume, sometimes the apparent losses costs are higher than the real losses costs, because water tariff is higher than the water production cost.
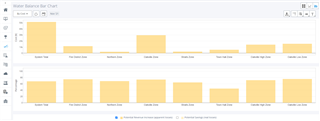
Figure 9 - Apparent losses cost (above) and cost in terms of percentage (below) for each zone
For more information about WaterSight, please go to OpenFlows WaterSight TechNotes and FAQ's.