| Product(s): |
WaterSight |
| Version(s): |
10.00. |
| Area: |
Documentation |
WaterSight automatically calculates patterns and forecasts for each sensor and zone based on the collected raw sensor data. The methodology used follows the below main steps:
- Raw data is collected
- Raw data gets cleaned up and resampled in the following intervals: 15 min,1hour, daily
- Machine learning together with statistical analysis is applied to the processed resampled time series to generate the patterns and confidence bands.
Patterns and confidence bands are represented in the graphs by a grey band, while real time measurements are represented by a back line filled with black, yellow and red dots. Whenever real data goes outside the pattern confidence bands (above percentile 95 or below percentile 5 of the pattern), an outlier is identified and the real value is color coded with a red circle.
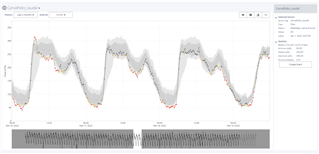
Figure 1 - Real time series (back line with black, yellow and red dots) and pattern confidence bands (grey band).
Below is shown a real resampled 15 minutes time series (black color) with the raw data at green and the patterns at grey. It is possible to observe some of the cleanup that is automatically done by the software, where some bad data was removed.
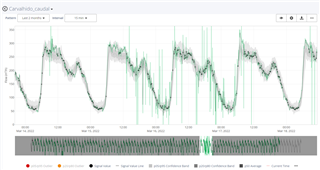
Figure 2 - Raw data at green, real 15 minutes time series (processed) at black and patterns at grey.
Pattern and forecasts are continuously and automatically being updated in real time (whenever new data arrives into WaterSight) using always last months of historical data. The historical period used to calculate the patterns is defined by the user, by changing the pattern dropdown window located above each graph. This means that the pattern for today is slightly different than the pattern of the previous day and will be slightly different from tomorrow pattern. This is particularly useful when there are significant changes in zone demands such as winter and summer, or when zones boundaries are changed. In these cases, patterns automatically adapt to the new sensor/zone condition.
Patterns can be calculated for each individual sensor or for a specific zone. To calculate the zone patterns, the final balance between all zone inflows and outflows (plus storage if exists) is considered. Zones tend to have clear and well defined patterns (the same may not apply to each individual sensor) as they represent a large group of customers with usually well defined demand behaviors that tend to repeat each day, being the main difference usually between weekday (workday) and weekend (not workday), as exemplified in figure below.
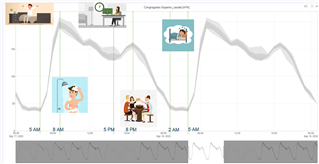
Figure 2 - Typical work day flow pattern for a residential zone (obtained from WaterSight)
As mentioned before the patterns are different depending on the day of the week. In WaterSight the default is to have a distinction between Weekday, Saturday and Sunday, but the user can customize differently by having for example a pattern that is different for each day of the week, or other use case. To know more about pattern customization, please click here.
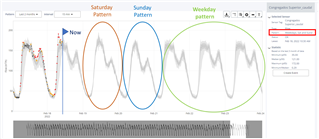
Figure 3 - Pattern forecasts for Saturday, Sunday and week day
Moreover anomalous events that may occur such as pipe breaks and meter failures can be automatically excluded from the patterns calculation so that patterns and forecasts do not get “polluted” by those anomalies. For that to happen, the user needs to make sure he correctly categorizes all the events that are generated. For more information please take a look here.
Figure 4 - Possibility to exclude from patterns anomalous events
Patterns and forecasts are mainly used for the real time anomaly detection (to generate alerts based on deviations to patterns) and also as boundary conditions for the model runs.
For more information about WaterSight, please go to OpenFlows WaterSight TechNotes and FAQ's.