| Product(s): |
WaterSight |
| Version(s): |
10.00. |
| Area: |
Documentation |
Overview
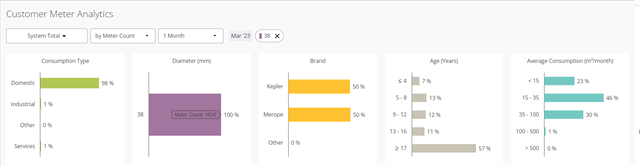
The customer analytics dashboard provides a summary of customer meters information clustered by different groups - consumption type, diameter, brand, age, average consumption, customer size - together with the evolution of the revenue, for the total system or by zone. The different clusters can be built based on the number of meters or volume consumed. It is also possible to drill-in into a specific group (such as a specific consumption type, or specific diameter, etc) and see the detailed information for that group (by selecting the desired group, by clicking in the respective bar chart).

Filters
System total
By default information is displayed for the total system. User can click in the dropdown box to see the customer information for each different zone.
By Meter Count
By default information is displayed by number of meters. User can also see the same information but grouped by volume consumed.
Period
By default information displayed is related to last month. User can define any period.
Additional filter - by group
The user can add an additional filter, by directly clicking in one of the bar charts, for which he wants to see the information. For example when clicking in the domestic group (first bar, under consumption type), all the information is updated and is related now to only the domestic customers. User can select other filters such as large customers, a specific brand or diameter or age, etc, etc.

Bar Charts
Consumption type
Distribution of customer meters (by number or by volume) in the following categories: domestic, industrial, services, other. Consumption types are defined in the customer configuration file.
Diameter
Distribution of customer meters (by number or by volume) by diameters. Diameters are defined in the customer configuration file.
Brand
Distribution of customer meters (by number or by volume) by brands. Brands are defined in the customer configuration file.
Age (years)
Distribution of customer meters (by number or by volume) by age. Age is automatically calculated based on installation date, that is defined in the customer configuration file.
Average consumption
Distribution of customer meters (by number or by volume) by consumption range. Consumption range is automatically calculated based on customer billings file.
Customer size (Large Customers)
Identification of the large customers (by number or by volume). Despite the number of large customers is usually very low when compared to the total number of meters, the volume consumed by those is usually very significant. The definition of the large customers is done in the customer configuration file.
Revenue Water
Monthly revenues and comparison with the homologous months. The period displayed is based on the period defined above on the filters by the user.
Interpreting Results
Importance of Large Customers
Large customers usually represent a very small portion of the total number of customers (when looking at number), however the volume or revenue associated with them is usually quite significant. Besides this, some of the large customers may also be sensitive customers, where risk of service interruption needs to be minimized or even avoided (such as hospitals). Due to this reason, the adequate management of large customers is crucial in terms of water losses reduction (through apparent losses decrease) and risk management.
The customer analytics dashboard clearly allows to identify the contribution of the large customers in terms of total revenue for the utility and their number. In the example below of a very small utility, large customers are 29 of 6610, representing 0.4% of the total customers, however when looking at the revenue, they are responsible for 14% of the total revenue of the water utility.
The user can take a look at the large customers number and revenue contribution for the total system or for each zone, by using the dropdown option located on the top. It is also possible to see all the related meters information only for the large customers (such as consumption type, diameters, brand, age, average consumption and monthly revenue evolution) by directly clicking in the large customers bar, under the customer size graph. Some other relevant analysis include:
- Crosscheck large customers with meters age. Aging meters tend to have higher sub-measurement errors associated and when it comes to large customers, the annual loss in revenue can be very significant. This dashboard can provide a first and quick glance of the overall age related with the large meters. More information below;
- Crosscheck large customers with diameters and average consumption. Utility should verify if large customer meters are well sized for the average consumption and flow values. Over-sized or under-sized meters can significantly contribute to sub-measurements and therefore significant losses in revenue for the utility. This dashboard can provide a first and quick glance of the overall meter size adequacy for the large customers. More information below;
- Check large customer monthly revenues and comparison with the previous year, and easily understand if large customers revenue is increasing or decreasing over year.
Meters sizing analysis (oversized and/or undersized)
Oversized or undersized meters are not able to measure at specific flows, and therefore can impact revenues (with an associated revenue loss). This is even most significant when those meters can have large consumptions associated which is the case of the large customers.
With the customer analytics dashboard the user can quickly identify - at a first glance - if significant problems related with bad sizing may exist . Steps include:
- On the Customer Analytics dashboard, select by meter count (and by total system or by zone)
- On the diameter chart, click hover the lowest diameter bar chart, to add additional filter by specific diameter
- Take a look at the average consumption bar chart information and look for potential issues.
- Repeat step 2 and 3 again for each different diameter group.
Below some examples:
- From 1140 meters with DN19 mm, 8 meters (1%) have an average consumption between 100 and 500 m3/month. There is a high chance of these meters to be undersized.

- From 1636 meters with DN38mm, 1127 meters (69%) have an average consumption below 35 m3/month. There is a high chance of these meters to be oversized.
Identification of anomalous decreases in consumption
Along with the information of the customer meters grouped by different clusters (consumption type, diameter, brand, age, etc) the dashboard always display a graph with the monthly revenue of the selected meters for the selected period (year selected and comparison with previous year). The selected meters for which the monthly revenue is calculated is based on the selections done on the top (by system or zone) and any additional filters (that are activated when clicking over a specific cluster, such as "domestic" or "Diameter 19mm").
With the customer analytics dashboard the user can quickly identify - at a first glance - if revenue for the selected group is increasing or decreasing. Steps include:
- Select the desired group of meters (by selecting system or by zone and by clicking over a specific cluster/bar chart)
- Select all period available
- Take a look at the monthly revenue evolution and compare if revenue is increasing or decreasing when comparing with the same period of the previous year
Apart from this, it is also relevant to highlight that the total number of zero consumptions each month is already calculated and displayed under Admin > Customers > Billing.

Sub-measurement potential
Apparent losses (that can be automatically calculated by the solution) can be divided into metering inaccuracies and unauthorized consumption (illegal uses). Metering inaccuracies or sub-measurement errors can have a significant impact, with a direct loss in revenue for the water utility. Those measurement errors are usually due to bad sizing of meters or aging (as meters tend to under-register with age).
Bad sizing issues were already addressed above. With regards to age, the customer analytics dashboard can display the overall age of the meters (total system or by zone) as well as for a specific group of meters, and the user can quickly understand potential issues.
In the extreme example below, 56% of all customers have more than 17 years, which is a red flag - and probably this utility is loosing significant revenue with those very old meters.

In another extreme example, of all large customers, 43% have meters with more than 17 years, which is also a red flag.

It is important to mention that when deciding to replace a meter, age should not be analysed alone, but always in conjunction with the volume consumed, because the meters with highest consumptions and older are those which the revenue loss is higher. Below another example where from 63 meters with average consumptions between 100 - 500 m3/month, 52% have more than 17 years. Those should be prioritized for replacement.

Configuration
The information displayed is based on the customer meters characteristics file and billings. Those files can be downloaded from the administration menu and after filled by the user should be uploaded again in the administration > Customers > Meters and Billing.
See Also
OpenFlows WaterSight TechNotes and FAQ's
Meters Characteristics Administration
Billings Administration