| Product(s): |
WaterSight |
| Version(s): |
10.00. |
| Area: |
Documentation |
Overview
Select what to configure:
Combined Condition
The combined condition alert can be useful when the user wants to combine the different symptoms that can lead/indicate the same event, such as:
- Combined trigger 1: a flow increase in a zone (condition 1) followed by a pressure decrease (conditions 2) can be an indication of a burst (event A);
- Combined trigger 2: a flow increase (condition 1) followed by a flow decrease (condition 2), by the same amount, in adjacent zones can be indication of zone boundary changes (event B);
- Combined trigger 3: a flow increase (condition 1) followed by an increase in the pressure immediately downstream the PRV (condition 2) may be be an indication of PRV setting point mismatch (event C);
- Combined trigger 4: an increase in the zone flow (condition 1) followed by a sudden increase in a large customer smart meter (condition 2) can be just an indication of an increase in consumption (event D);
- Combined trigger 5: a pressure dropping significantly (condition 1) can be an indication of a pump turning off (Event D) in case pump status turns off (condition 2);
- etc
Each example above has different symptoms (conditions) that lead to the same event and the main goal is to minimize false positives.
The combined condition trigger is flexible enough for the users to select as many conditions as they want, and to define a AND or OR conditions.
For each combined condition there is a primary trigger. Once a combined event is generated, the alert graph detail as well as the event properties such as max value and volume lost are related to this primary trigger. Volume lost in combined events is only calculated if the primary trigger is a flow increase (high pattern/high absolute condition).

By using the "All False" option at the bottom, the user can specify an event to be generated when the secondary conditions rules defined are NOT met.
The user can directly move from the event graph detail (which is related to the primary trigger) to the graph where all conditions are represented, by clicking in the graph comparison shortcut from the event graph detail page.
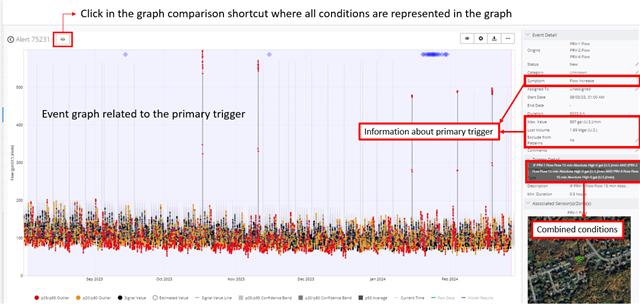
Figure 1 - Combined Event graph detail (accessible from the Active event list or from the sensor/zone graph related to the primary trigger)
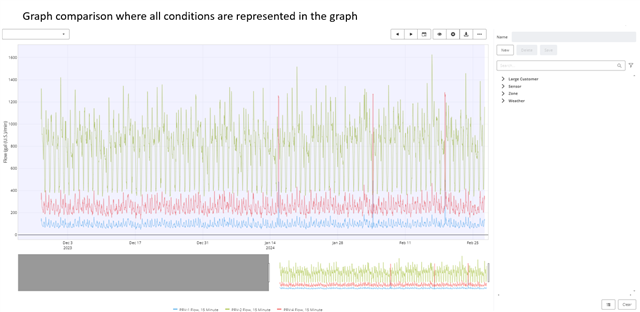
Figure 2 - Graph comparison where all conditions are represented in one graph (accessible from the graph comparison shortcut presented in the combined alert detail graph - Figure 1)
See Also
Simple Condition triggers
Active Events
Configuring bursts alerts
Absolute based alerts
Subscriber groups
OpenFlows WaterSight TechNotes and FAQ's.