| Product(s): |
SewerGEMS, CivilStorm |
| Version(s): |
CONNECT Edition, V8i |
| Area: |
Calculations |
Background
The Hydraulic Reviewer is a tool available for the Implicit and Explicit (SWMM) solvers in SewerGEMS and CivilStorm. It enables you to see water mass balance on a per-element level, to help identify specific areas in the model that experience overflow (for example) or mass balance error due to instability. This can help you pinpoint where problems may be occurring in the model that lead to an overall high continuity error (as seen in the calculation summary) and model instability.
You can also view overflow volume on a per-element basis.
Using the Hydraulic Reviewer
First, select the scenario of interest using the drop down list. The calculation of the scenario must already have been run.
There are two main tabs in the tool: "Storage Element Volume Balance" and "Pipe Flow Statistics"
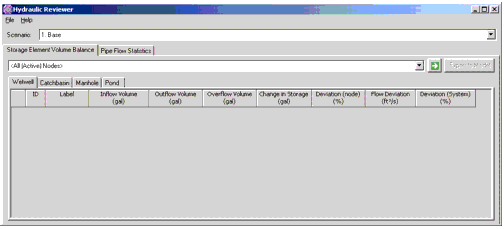
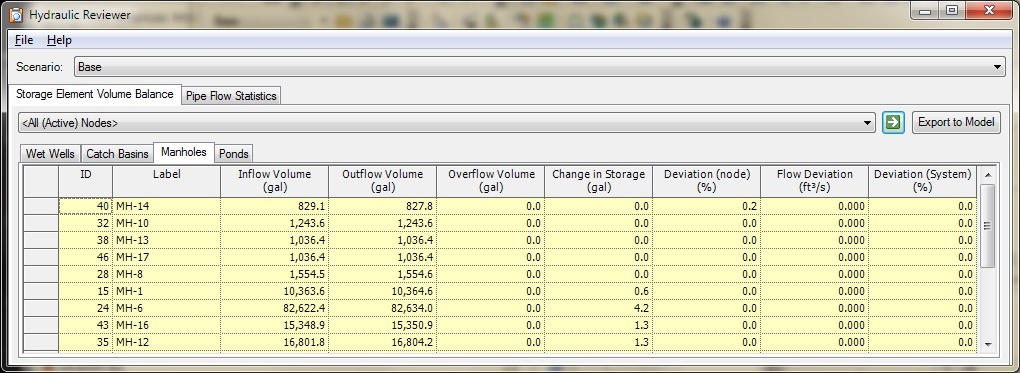
Storage Element Volume Balance
The Storage Element Volume Balance tab determines the overall mass balance at any node which can have storage which includes Wet Wells, Catch basins, Manholes and Ponds.
The user can also use a drop down list of any previously created selection set of node elements on which to perform the review. The default is All Active Nodes.
Click the green Go arrow to start the calculation which for each node determines the inflow, outflow and overflow volumes over the course of the runs and the percent deviation from perfect flow balance as described in this article: What is the continuity error and what's a good percentage for it?
The results are presented in decreasing order based on Error. Any column can be sorted, filtered or have the display format changed as with any other flex table. The elements with high Error are candidates for deeper review. Right click on the row header and choose "zoom to" to locate the element in the drawing, then investigate for data entry issues, create and examine profiles of the surrounding area, etc.
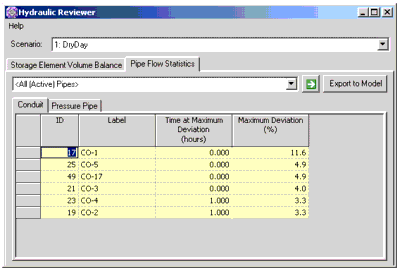
Pipe Flow Statistics
The Pipe flow statistics tab provides an indication of the change of flow rates from one time step to the next. This can be helpful in identifying pipes with unstable results (and the flow suddenly "spikes"), so you can examine the specific area more closely (right click the row header and choose to Zoom To).
To use this tab, the user can chose All Pipes (the default) or any selection set of pipes. The calculation is run by clicking the green Go arrow. It will display a table like the one below, sorted in order of decreasing Maximum Deviation.
Note: High values for Maximum Deviation do not necessarily indicate that the model contains errors or is unstable. Some pipe links have very large changes in flow from one time step to another such as in the case of a pump cycling on an off. In some cases, numerical models can overshoot the calculated flow when the flow rate changes abruptly. This effect usually dies out after one or two time steps. Nevertheless, the Maximum Deviation can serve as an indicator of locations with possible stability issues.
Results Export
Once the calculations have been performed, the user can export the values to a previously created User Data Extension so that the values can be used in color coding, flex tables, etc. Click on Export to Model to reach the dialog below and select Export to actually export the numerical values.
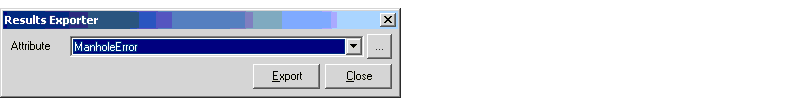
If the user defined property doesn't exist, the user can create one by picking the ellipse button and following the instructions for user data extensions. Note that the user defined property the data will be exported to must use the following settings
- Data Type: Real
- Dimension: Percent
- Storage Unit: Percent
Troubleshooting High Deviation
A high deviation for storage or pipes can often indicate data entry issues in the area and/or the need to fine tune the calculation options. In some cases changing the solver can be warranted as they each have their own strengths. For example in a model with ponds and outlets, the Explicit (SWMM) solver is often a better choice (with Routing Step of 1 second and smaller Output Increment), whereas a model with manifolded pumping is often better suited for the Implicit solver (calculation timestep between 0.005 and 0.025 is typical).
It is always best to first zoom to the elements that have high deviation in the Hydraulic Reviewer and check for data entry issues, simplify the model wherever possible, and consider focusing your model down to just the section of interest (inactivate other, disconnected parts of the model temporarily) and reduce the simulation duration to just long enough to observe any problematic results, so that the model calculation is faster during your troubleshooting.
Further guidance can be found here:
Video Demonstration
See Also
How to find volume (such as overflow volume) through specific elements
What is the continuity error and what's a good percentage for it?