| |
Applies To |
|
|
| |
Product(s): |
WaterGEMS, WaterCAD |
|
| |
Version(s): |
V8i SELECTSeries 2 and later |
|
| |
Area: |
Modeling |
|
| |
Original Author: |
Nancy Mahmoud, Bentley Technical Support Group |
|
Overview
This article explains the steps needed to perform a Pipe Break Analysis in WaterGEMS and WaterCAD. The Pipe Break Analysis is a part of Pipe Renewal Planner tool.
Background
WaterGEMS and WaterCAD provide a useful tool to analyze pipe breakage over time and also calculates a projected pipe break rate and auxiliary costs based on historical pipe break data. It is important to note that WaterGEMS and WaterCAD compute and display the results based on the data entered by the user, and it does not come up with the pipe break history. Hence, it is important to accurately enter this data. The results of pipe break analysis are useful in themselves but they also serve as one of the inputs to Pipe Renewal Planner.
Before You Begin
You will need:
1) The WaterGEMS or WaterCAD model
2) Pipe break history data, which can be entered directly in WaterGEMS and WaterCAD, or imported from an external source file (i.e. Excel spreadsheet), which can be in either of these two formats:
· A table with one record per pipe consisting of pipe ID in one column and the number of breaks in another column (Pipe Break Table)
· A table with one record per pipe break (failure) with the pipe ID serving as one of the fields in each record (Failure History)
3) Define Pipe Break Groups by creating selection sets of pipes that share similar properties with respect to pipe breakage. These properties would include similar age, material, laying condition and loading and period of break records. Pipe Break Groups can be modified or created by selecting Components > Pipe Break Groups.
Note: It is usually best to create selection sets of such pipes before starting the pipe break analysis. Name the group with a label that reflects the pipes in the group. If a pipe is not assigned to a group, its individual break rate will be used as the scaled break rate.
Setting Up Scenario with Pipe Break Alternative
Create a scenario to use with the Pipe Break Analysis, or use existing scenario if you wish. Make sure to set the scenario with the Pipe Break Alternative as current. (See TechNote on Scenario and Alternatives if you need help setting them up).
The alternative associated with the Pipe Break Analysis is “Failure History”.
1) Go to Components > Alternatives
2) Expand the Failure History alternative then double-click on Base Failure History
3) Enter the “Duration of Pipe Failure History” value on top. If it is different for several pipes, check the “Use Local Duration of Pipe History” field, then you can enter the correct value for each pipe in the Duration of Pipe History column.
4) Data for the pipe break analysis can be entered in the alternative window, or it can be entered in the Pipe Break Analysis window (see below).
Start Pipe Break analysis
To open the Pipe Break Analysis tool, go to Analysis > Pipe Renewal Planner > Pipe Break
(In V8i, go to Analysis > Pipe Break, or click on the Pipe Break icon on the toolbar.)
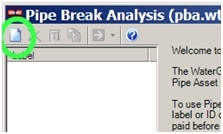
This will open the Pipe Break Analysis wizard.
1) In the wizard, click the New button
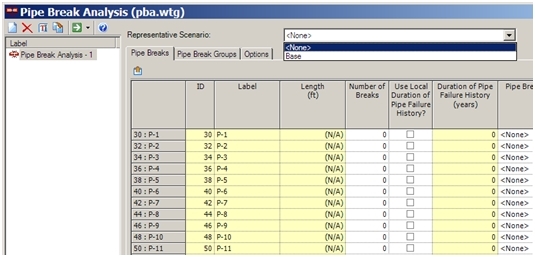
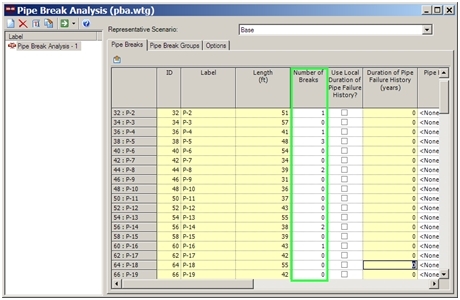
2) Select the scenario from the drop-down list in which you want to perform the pipe break analysis
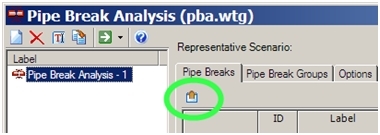
3) Now, to bring in the pipe break history, you can either enter it manually in the table, or use the Import button to bring it from a data source file (i.e. Excel spreadsheet, Access, etc). To import data from a file, click on the Import button
4) In the Import wizard screen, select the data source type and browse to the location of the file. Click on Next.

5) Confirm the scenario in which this data will be imported, and the key field to be used. Click on Next.

6) On this screen, you will map the fields in the data source file with the fields in the model. Choose the Key Field, which is likely to be Label.

Note: You can also use the import wizard to bring in Pipe Break Group data, but in order to do that, the Pipe Break Groups have to be defined first (which will be discussed later on).
7) Click on Finish. If prompted, click on Yes to synchronize the drawing.
8) Close out of ModelBuilder Summary. Review imported data in the table.
Pipe Break Group
To assign pipes to pipe break groups, you can do by either:
a) Assign pipes of different groups to different selection sets
b) Create Pipe Break Groups and then use the import feature to bring in the data from a data source file (i.e. Excel spreadsheet).
c) Add pipes from the drawing manually to Pipe Break Groups
a. Creating Selection Sets for each Pipe Break Group
First create selection sets of pipes for each one of the different pipe break groups.
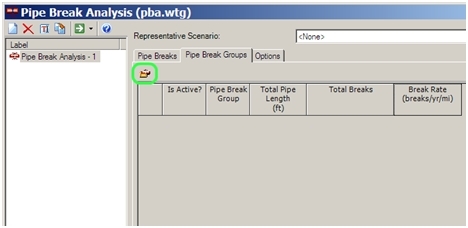
1) Open the Pipe Break Analysis
2) Click on the Pipe Break Group tab to setup the pipe break groups.
3) Click on the Pipe Break Group button
4) Click on the New button in the next window.
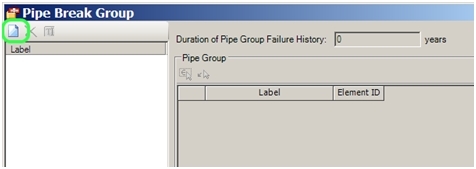
5) Click on the “Add Pipes from Selection Set” icon
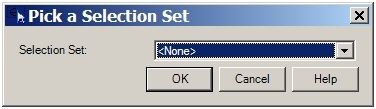
6) Then choose the selection set to bring in.
7) Repeat the steps above to bring in all other pipe break groups.
b. Create Pipe Break Groups, then Import Pipe Break Group data
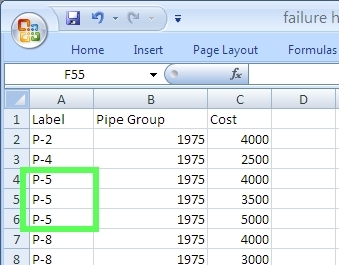
If you have the pipe break groups listed in a data source, then you can use the steps below to assign them in your model. It can look like this for the Pipe Break Table:
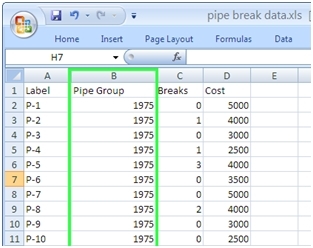
or this, if it is a Failure History (note how each pipe is listed once for each break record):
1) Open the Pipe Break Analysis
2) Click on the Pipe Break Group tab to setup the pipe break groups.
3) Click on the Pipe Break Group button

4) Click on the New button in the next window.

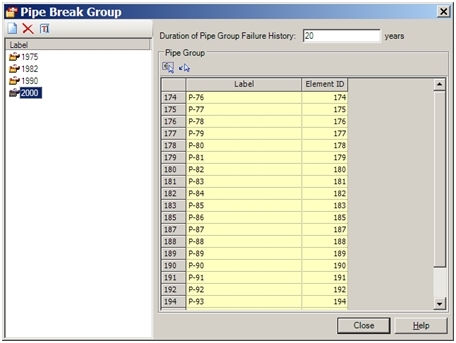
5) Create the pipe break groups for your model and rename them to match the name in the data source file.
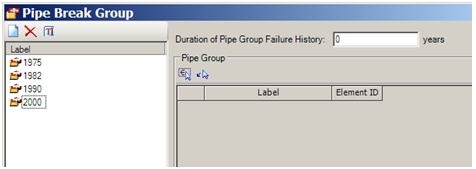
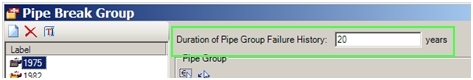
6) Enter the “Duration of Pipe Group Failure History” for each group you created
7) Next, click on Close. Then go to the Pipe Break tab, and click on the import button.
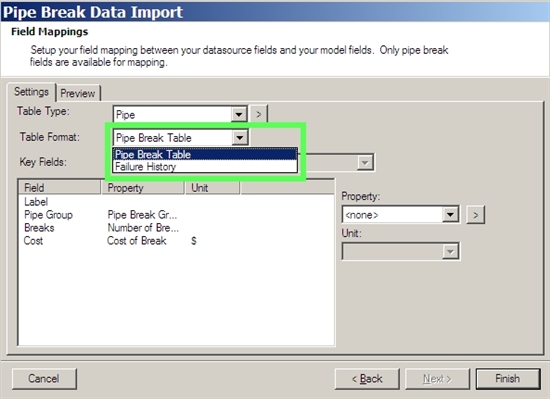
8) Follow the steps above to map the fields in the data source with the Pipe Break Group (label) in the model. Note: make sure to select the correct table format for your data source (if Failure History is selected, the "Number of Breaks" field will not be available).
9) Click on Finish.
10) Now click on the Pipe Break Group tab, then click on the Pipe Break Group button. The pipes should now be listed under its associated group. Click on Close.
Setting Analysis Options
1) Click on the Options tab
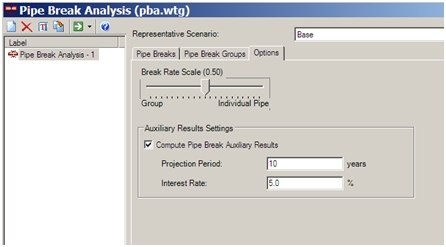
2) Under “Break Rate Scale”, move the scale to select the extent to which the overall scaled pipe break rate for the pipe is based on the individual pipe's history (a value near 1) or the group's history (a value near 0). Moving the slider to the left, lowers the value 'a' in the following equation, and increases the importance of the group while moving it to the right increases 'a' and decreases the importance of the group.
Projected break rate = a (Individual break rate) + (1- a) (Group break rate)
3) Check the “Compute Pipe Break Auxiliary Results” box if you want to display projected number of breaks and their break costs. Enter the Projection Period and Interest Rate to be used in projecting breaks and cost.
Run the Analysis
1) Click on the Compute button

2) Review the results under the Pipe Break tab
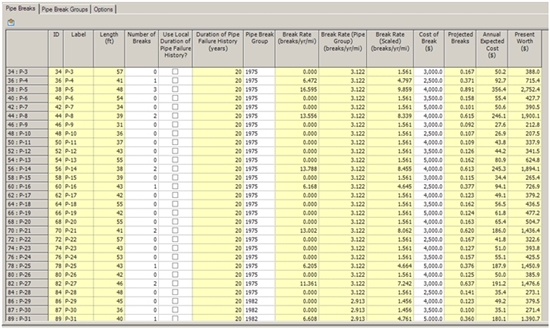
The results that are calculated by the Pipe Break Analysis include:
· Break rate (breaks/yr/mi) - based on length and number of breaks for individual pipe over the duration of break history for that pipe
· Break rate (Pipe Group) (breaks/yr/mi) - based on the number of breaks and total length of pipe in the group that this pipe belongs to over the duration assigned in the pipe group dialog.
· Break Rate (Scaled) (breaks/yr/mi) - based on the weighted sum of the individual pipe break rate and the break rate for the group that the pipe belongs.
· Projected breaks - the product of the scaled break rate, the projection period and the length of pipe. Estimate of the number of breaks over the projection period assuming that past break rates persist.
· Annual cost - the product of the scaled break rate, the length of pipe and the cost per break. Estimate of the annual cost of breaks.
· Present worth - the product of the scaled break rate, the length of pipe and the cost per break multiplied by the series present worth factor. Estimate of the present worth of all break costs over the projection period.
The results can also be color coded under the Element Symbology, to display the number of breaks, break rate, or any of the other calculated fields:

See Also
SCADAConnect Simulator for WaterGEMS (V8i SELECTseries 6 and CONNECT edition)